. 2009 Feb 25;29(8):2414-27.
doi: 10.1523/JNEUROSCI.5687-08.2009.

Age-dependent alterations of corticostriatal activity in the YAC128 mouse model of Huntington disease

Affiliations

Age-dependent alterations of corticostriatal activity in the YAC128 mouse model of Huntington disease

Prasad R Joshi et al. J Neurosci. .

Abstract

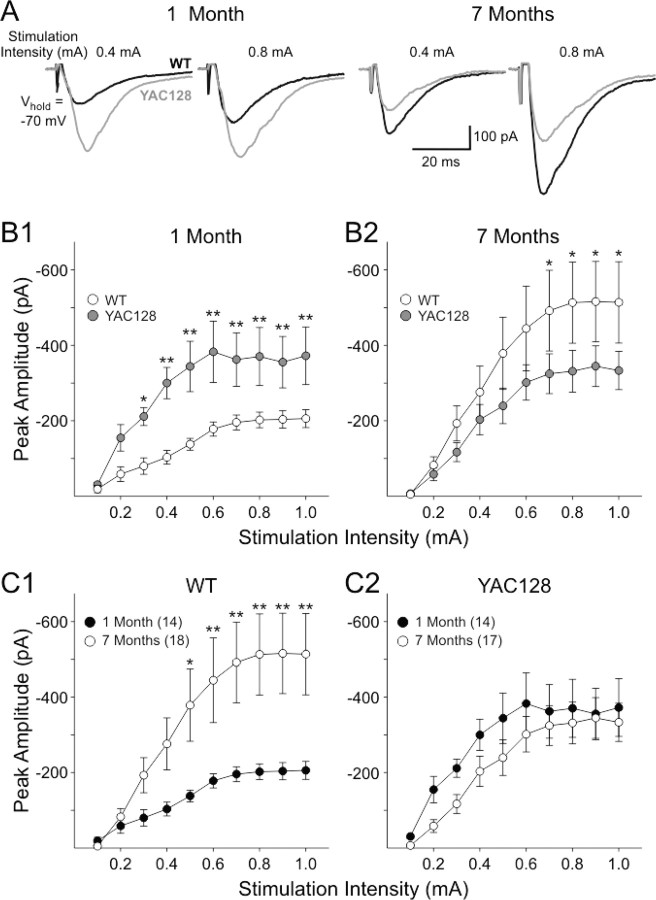
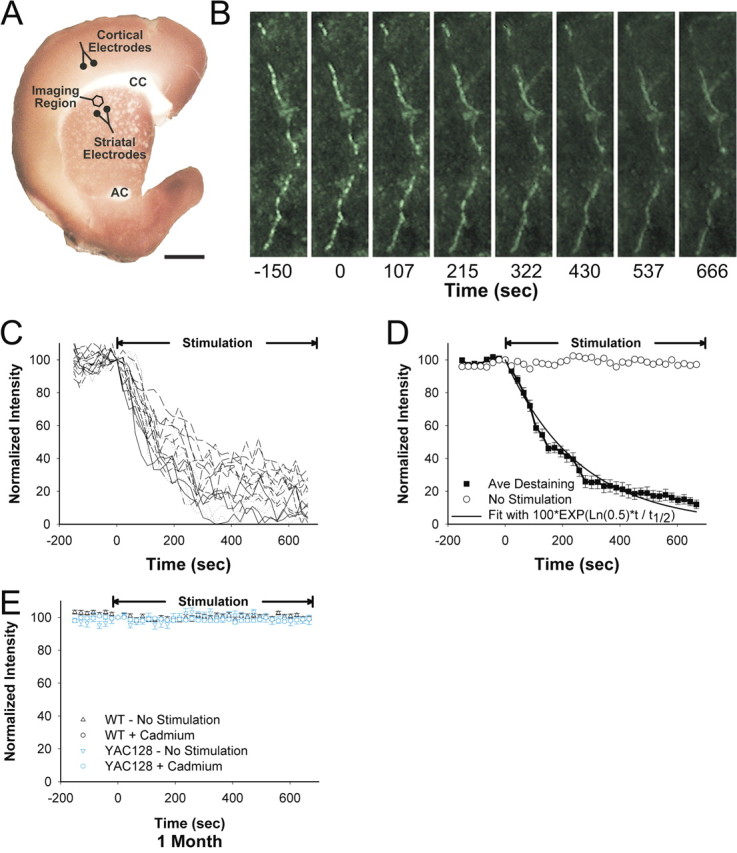
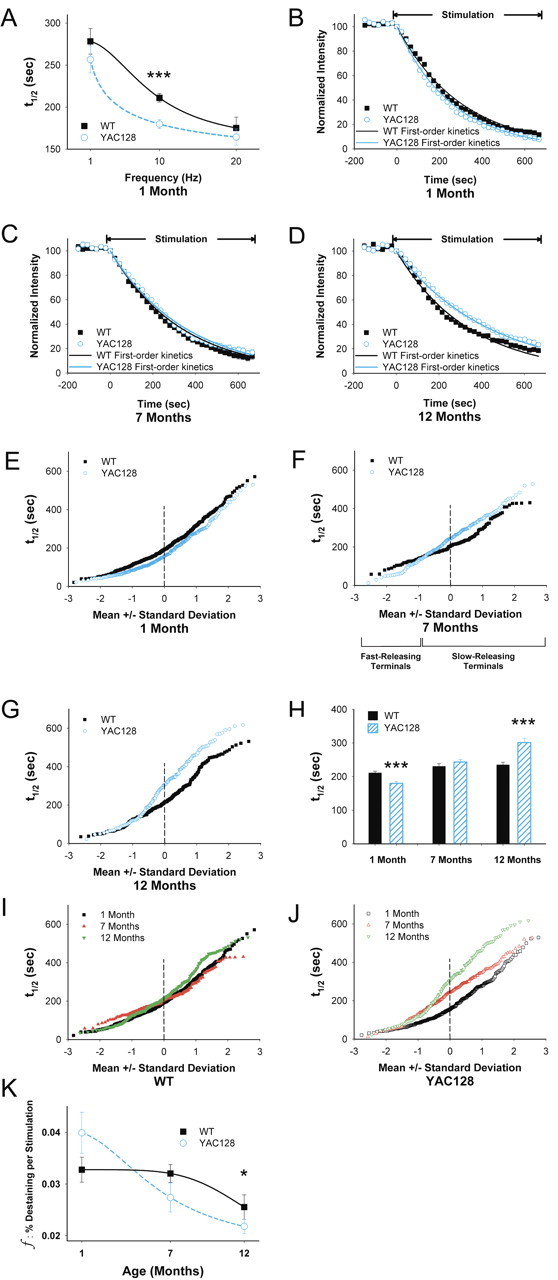
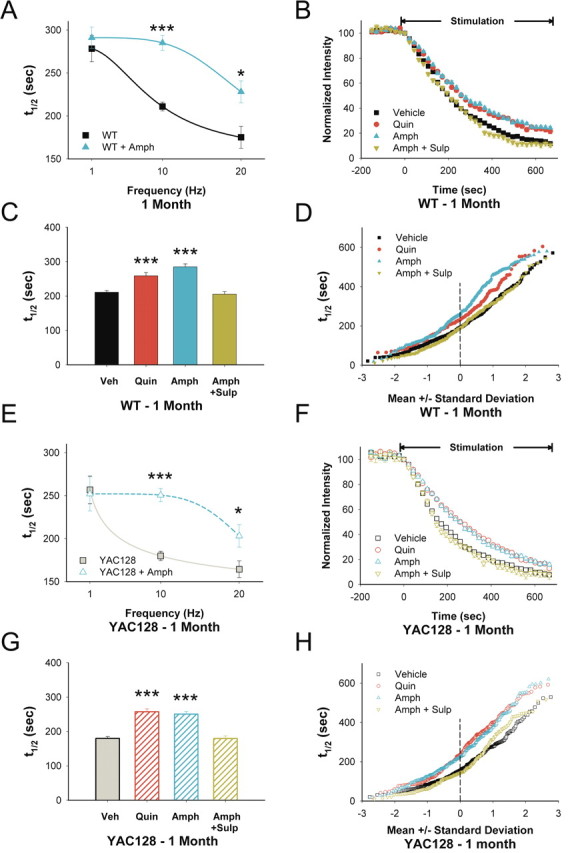
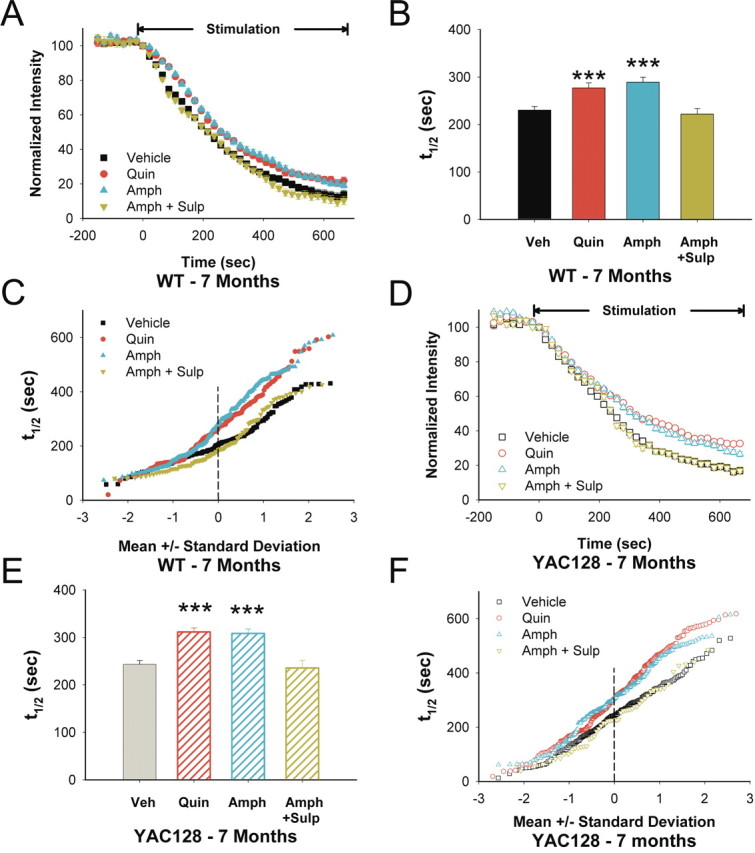
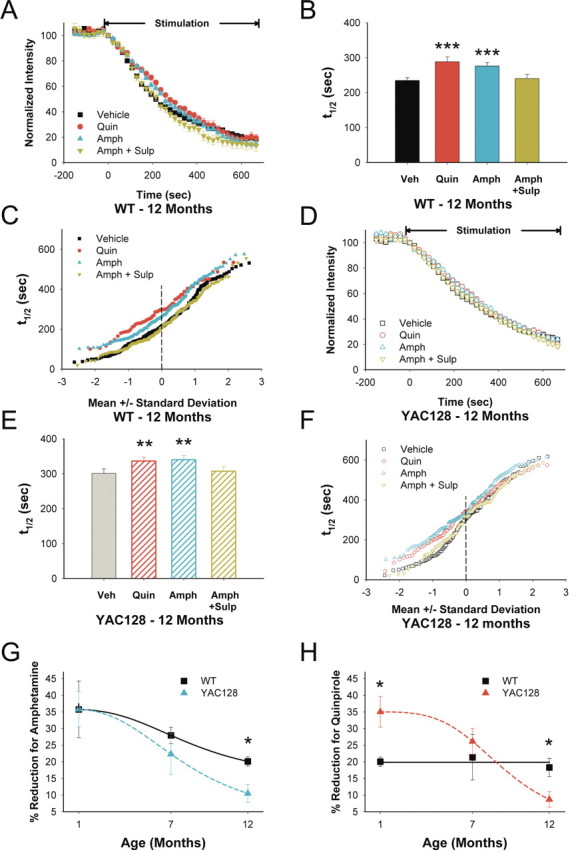
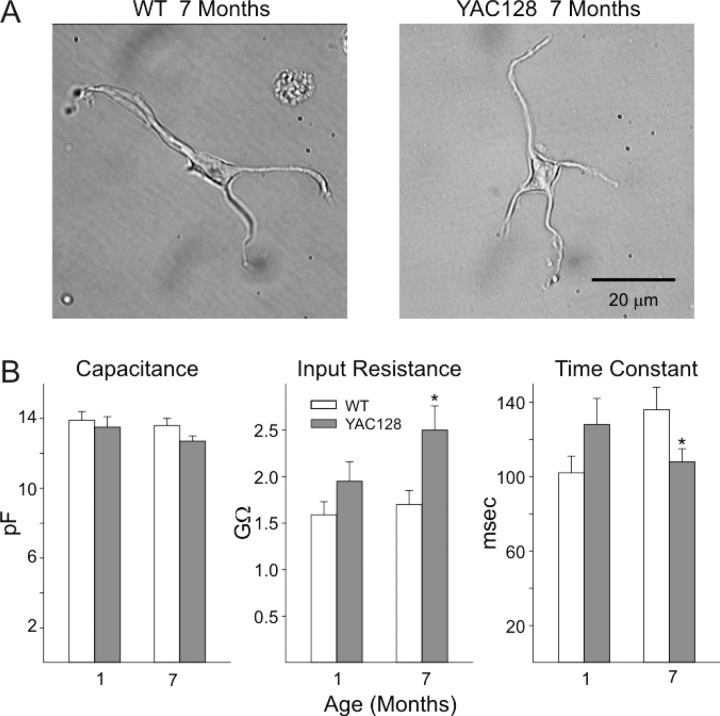
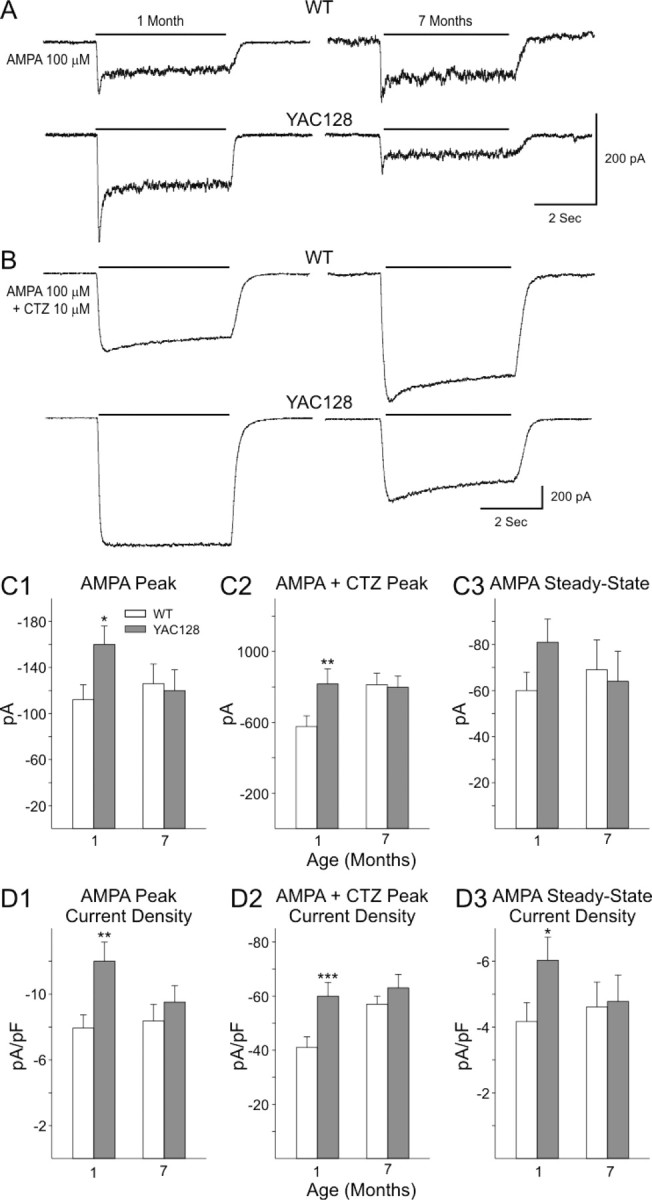
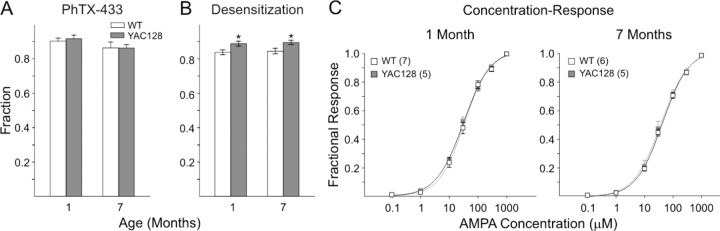
Huntington disease is a genetic neurodegenerative disorder that produces motor, neuropsychiatric, and cognitive deficits and is caused by an abnormal expansion of the CAG tract in the huntingtin (htt) gene. In humans, mutated htt induces a preferential loss of medium spiny neurons in the striatum and, to a lesser extent, a loss of cortical neurons as the disease progresses. The mechanisms causing these degenerative changes remain unclear, but they may involve synaptic dysregulation. We examined the activity of the corticostriatal pathway using a combination of electrophysiological and optical imaging approaches in brain slices and acutely dissociated neurons from the YAC128 mouse model of Huntington disease. The results demonstrated biphasic age-dependent changes in corticostriatal function. At 1 month, before the behavioral phenotype develops, synaptic currents and glutamate release were increased. At 7 and 12 months, after the development of the behavioral phenotype, evoked synaptic currents were reduced. Glutamate release was decreased by 7 months and was markedly reduced by 12 months. These age-dependent alterations in corticostriatal activity were paralleled by a decrease in dopamine D(2) receptor modulation of the presynaptic terminal. Together, these findings point to dynamic alterations at the corticostriatal pathway and emphasize that therapies directed toward preventing or alleviating symptoms need to be specifically designed depending on the stage of disease progression.


Figures

Figure 1.
Figure 1.
AMPA receptor-mediated synaptic responses in YAC128 mice. A, Representative traces showing inward currents evoked by the same two intensities of stimulation in cells from YAC128 and WT mice at each age. B, Graphs showing mean ± SE peak current evoked by the series of increasing intensities of stimulation at 1 month (B1) and 7 months (B2). C, Graphs showing comparisons of mean ± SE peak current responses for cells from WT (C1) and YAC128 (C2) mice at each age. Numbers of cells for each age group for all graphs are shown in C1 and C2.
Figure 2.
Figure 2.
Loading and unloading of corticostriatal terminals with FM1-43. A, A corticostriatal slice stained with 3,3′-diaminobenzidine shows the areas of stimulation and recording. Corticostriatal terminals were loaded with FM1-43 by stimulation with bipolar electrodes placed over cortical layers V–VI (Cortical Electrodes), located 1.5–2.0 mm from the imaging site. Multiphoton images of corticostriatal terminals were obtained from the corresponding motor striatum. Dopamine was released by amphetamine or by local striatal stimulation (Striatal Electrode). CC, Corpus callosum; AC, anterior commissure. Scale bar, 1 mm. B, Multiphoton images of corticostriatal terminals obtained from the dorsal striatum of a 1-month-old YAC128 transgenic mouse. Images captured every 21.5 s reveal en passant arrays of corticostriatal terminals. Restimulation at t = 0 with 10 Hz pulses shows activity-dependent destaining of fluorescent puncta. Scale bar, 2 μm. C, Time–intensity analysis of FM1-43 release from individual puncta (n = 18) shown in B. Stimulation begins at t = 0 s. D, Mean ± SE fluorescence intensity of puncta over time shown in B is compared with a single exponent curve. The plateau line represents fluorescence measurements from nondestaining puncta. E, No destaining was observed in WT or YAC128 slices receiving either no stimulation (n = 24–29) or at 10 Hz stimulation after superfusion in cadmium (n = 44–23).
Figure 3.
Figure 3.
Age-dependent changes in corticostriatal release. A, FM1-43 destaining is dependent on the frequency of cortical stimulation. n = 89–425 puncta for each condition; ***p < 0.001, Mann–Whitney test. B, Time–intensity analysis of FM1-43 destaining in slices from YAC128 mice at 1 month demonstrates an increase in release compared with same-aged WTs. Release from both WT and YAC128 mice approximate first-order kinetics. C, Time–intensity analysis of FM1-43 release in slices from YAC128 mice at 7 months demonstrates a similar rate of destaining compared with WTs. Release from both WT and YAC128 mice approximated first-order kinetics. D, At 12 months, FM1-43 release in slices from YAC128 mice showed a slower rate of destaining compared with WTs, with release approximating single-exponent kinetics. E, Normal probability plot of individual terminal halftimes of release from averaged puncta shown in B. F, Individual terminal halftimes of release from averaged puncta shown in C. G, Individual terminal halftimes of release from averaged puncta shown in D. H, Distribution of mean t1/2 of release for destaining curves shown in B–D. For WTs, n = 425, 160, and 258 puncta at 1, 7,and 12 months, respectively. For YAC128 mice, n = 353, 196, and 139 puncta at 1, 7, and 12 months, respectively. ***p < 0.001 compared with WT littermates, Mann–Whitney test. I, Individual terminal halftimes of release in WTs at 1, 7, and 12 months. J, Individual terminal halftimes of release in YAC128 mice at 1, 7, and 12 months. K, The fractional release of FM1-43 declined with age. n = 31 for each condition, *p < 0.05, ANOVA. Curves for A and K were fit with a Hill equation.
Figure 4.
Figure 4.
D2 receptors modulate corticostriatal release in 1-month-old YAC128 mice. A, Release halftimes for 1-month-old WT slices after cortical stimulation at 1, 10, and 20 Hz in the presence and absence of amphetamine in vitro (n = 89–425 puncta for each condition; *p < 0.05, ***p < 0.001, Mann–Whitney test). B, Compared with untreated slices (Veh), both the D2 receptor agonist quinpirole (Quin) and amphetamine (Amph) decreased FM1-43 destaining in slices from 1-month-old WT mice. The inhibitory effect of Amph was reversed by the D2 receptor antagonist sulpiride (Amph+Sulp). C, Distribution of mean t1/2 of release for destaining curves shown in B. n = 346, 194, 246, and 224 puncta for Veh, Quin, Amph, and Amph+Sulp, respectively. ***p < 0.001 compared with Veh, Mann–Whitney test. D, Individual terminal halftimes of release from averaged puncta shown in B. E, Release halftimes for 1-month-old YAC128 slices after cortical stimulation at 1, 10, and 20 Hz in the presence and absence of amphetamine in vitro (n = 62–353 puncta for each condition; *p < 0.05, ***p < 0.001, Mann–Whitney test). Curves for A and E were fit with a Hill equation. F, Compared with untreated slices (Veh), both the D2 receptor agonist Quin and Amph decreased FM1-43 destaining in slices from 1-month-old YAC128 mice. The inhibitory effect of Amph was reversed by addition of the D2 receptor antagonist Sulp (Amph+Sulp). G, Distribution of mean t1/2 of release for destaining curves shown in F. n = 284, 271, 285, and 277 puncta for Veh, Quin, Amph, and Amph+Sulp, respectively. ***p < 0.001 compared with Veh, Mann–Whitney test. H, Individual terminal halftimes from averaged puncta shown in F.
Figure 5.
Figure 5.
D2 receptor responses in 7-month-old YAC128 mice. A, In 7-month-old WTs, both quinpirole (Quin) and amphetamine (Amph) decreased FM1-43 destaining. The inhibitory effect of Amph was reversed by sulpiride (Sulp). B, Distribution of mean t1/2 of release for destaining curves shown in A. n = 160, 135, 178, and 118 puncta for vehicle (Veh), Quin, Amph, and Amph+Sulp, respectively. ***p < 0.001 compared with Veh, Mann–Whitney test. C, Individual terminal halftimes of release from averaged puncta shown in A. D, In 7-month-old YAC128 mice, both Quin and Amph decreased FM1-43 destaining. The inhibitory effect of Amph was reversed by Sulp. E, Distribution of mean t1/2 of release for destaining curves shown in D. n = 196, 282, 193, and 52 puncta for Veh, Quin, Amph, and Amph+Sulp, respectively. ***p < 0.001 compared with Veh, Mann–Whitney test. F, Individual terminal halftimes of release from averaged puncta shown in D.
Figure 6.
Figure 6.
D2 receptor responses in 12-month-old YAC128 mice. A, In 12-month-old WTs, both quinpirole (Quin) and amphetamine (Amph) inhibited FM1-43 release. Sulpiride (Sulp) reversed the effect of Amph. B, Distribution of mean t1/2 of release for destaining curves shown in A. n = 258, 56, 157, and 127 puncta for vehicle (Veh), Quin, Amph, and Amph+Sulp, respectively. ***p < 0.001 compared with Veh, Mann–Whitney test. C, Individual terminal halftimes of release from averaged puncta shown in A. D, In slices from 12-month-old YAC128 mice, both Quin and Amph inhibited FM1-43 release. Sulp reversed the modulating effect of Amph. E, Distribution of mean t1/2 of release for destaining curves shown in D. n = 139, 133, 153, and 96 puncta for Veh, Quin, Amph, and Amph+Sulp, respectively. **p < 0.01 compared with Veh, Mann–Whitney test. F, Individual terminal halftimes of release from averaged puncta shown in D. G, Percentage change in average corticostriatal terminal halftimes after Amph. n = 4 mice per condition. *p < 0.05, ANOVA. H, Percentage change in average corticostriatal terminal halftimes after Quin. n = 4 mice per condition. *p < 0.05, ANOVA. Curves for G and H were fit with a Hill equation.
Figure 7.
Figure 7.
Membrane properties of acutely dissociated striatal MSNs. A shows representative images of MSNs from YAC128 mice and their WT littermates at 7 months. B shows bar graphs of mean ± SE capacitance, input resistance, and time constants from cells from YAC128 mice at 1 and 7 months. Numbers of cells: 1 month YAC128 = 18, WT = 26; 7 month YAC128 = 35, WT = 22. *p < 0.05, **p < 0.01, ***p < 0.005.
Figure 8.
Figure 8.
AMPA currents in acutely dissociated MSNs from YAC128 and WT mice. A, B, Representative traces showing inward currents evoked by 100 μm AMPA, either alone or in the presence of 10 μm CTZ, from MSNs from YAC128 and WT mice at 1 and 7 months. Note higher peak AMPA and AMPA plus CTZ currents at 1 month and AMPA steady-state currents at 1 month in YAC128 mice. C, Bar graphs illustrating mean ± SE peak AMPA currents (C1), mean peak AMPA plus CTZ currents (C2), and mean AMPA steady-state currents (C3) at each age. D, Bar graphs illustrating mean ± SE peak AMPA current densities (D1), mean peak AMPA plus CTZ current densities (D2), and mean AMPA steady-state current densities (D3) at each age. Numbers of cells in each group are the same as in Figure 7. *p < 0.05, **p < 0.01, ***p < 0.005.
Figure 9.
Figure 9.
Effects of PhTX-433 and desensitization of AMPAR responses and concentration–response functions in striatal MSNs. A, Bar graphs showing mean ± SE fractional AMPA plus CTZ peak currents after inhibition by 10 μm PhTX-433 in acutely dissociated MSNs from YAC128 mice at each age tested. Fractional peak currents in MSNs from YAC128 mice and their WT littermates were similar at each age. B, Bar graphs showing mean ± SE fractional AMPA plus CTZ currents at 1.5 s after the peak in acutely dissociated MSNs from YAC128 mice and their WT littermates at each age tested. A higher mean fractional current occurred in YAC128 mice at both 1 and 7 months. Numbers of cells: 1 month YAC128 = 18, WT = 16; 7 month YAC128 = 11, WT = 11. *p < 0.05. C, Concentration–response functions to application of an increasing series of AMPA concentrations (0.1–1000 μm) in the continuous presence of 10 μm CTZ. Peak currents were recorded at each concentration, and points were fitted to concentration–response functions. EC50 values and Hill coefficients were similar in YAC128 cells and those from their respective WT littermates at all ages examined. Numbers of cells for each group are in parentheses.

Similar articles

Cited by

References

    1. Albin RL, Young AB, Penney JB. The functional anatomy of basal ganglia disorders. Trends Neurosci. 1989;12:366–375. - PubMed
    1. Albin RL, Reiner A, Anderson KD, Penney JB, Young AB. Striatal and nigral neuron subpopulations in rigid Huntington's disease: implications for the functional anatomy of chorea and rigidity-akinesia. Ann Neurol. 1990;27:357–365. - PubMed
    1. André VM, Cepeda C, Venegas A, Gomez Y, Levine MS. Altered cortical glutamate receptor function in the R6/2 model of Huntington's disease. J Neurophysiol. 2006;95:2108–2119. - PubMed
    1. Ariano MA, Aronin N, Difiglia M, Tagle DA, Sibley DR, Leavitt BR, Hayden MR, Levine MS. Striatal neurochemical changes in transgenic models of Huntington's disease. J Neurosci Res. 2002;68:716–729. - PubMed
    1. Ariano MA, Cepeda C, Calvert CR, Flores-Hernández J, Hernández-Echeagaray E, Klapstein GJ, Chandler SH, Aronin N, DiFiglia M, Levine MS. Striatal potassium channel dysfunction in Huntington's disease transgenic mice. J Neurophysiol. 2005;93:2565–2574. - PubMed

Publication types

MeSH terms