. 2009 Feb 25;29(8):2428-39.
doi: 10.1523/JNEUROSCI.5015-08.2009.

The BOLD response in the rat hippocampus depends rather on local processing of signals than on the input or output activity. A combined functional MRI and electrophysiological study

Affiliations

The BOLD response in the rat hippocampus depends rather on local processing of signals than on the input or output activity. A combined functional MRI and electrophysiological study

Frank Angenstein et al. J Neurosci. .

Abstract

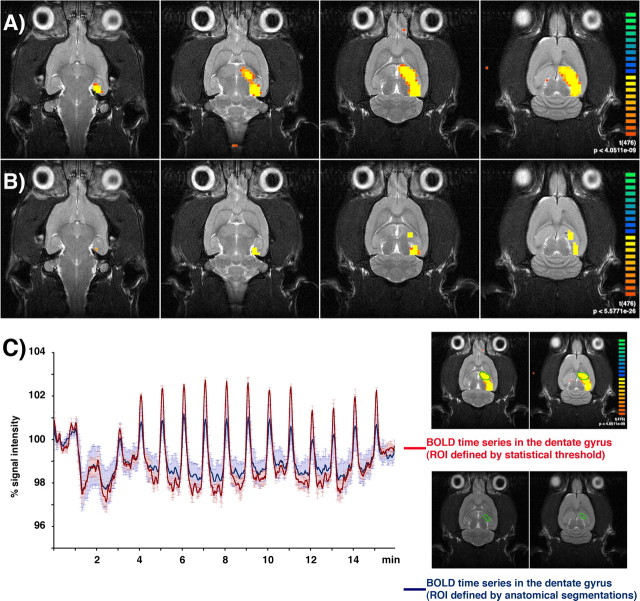
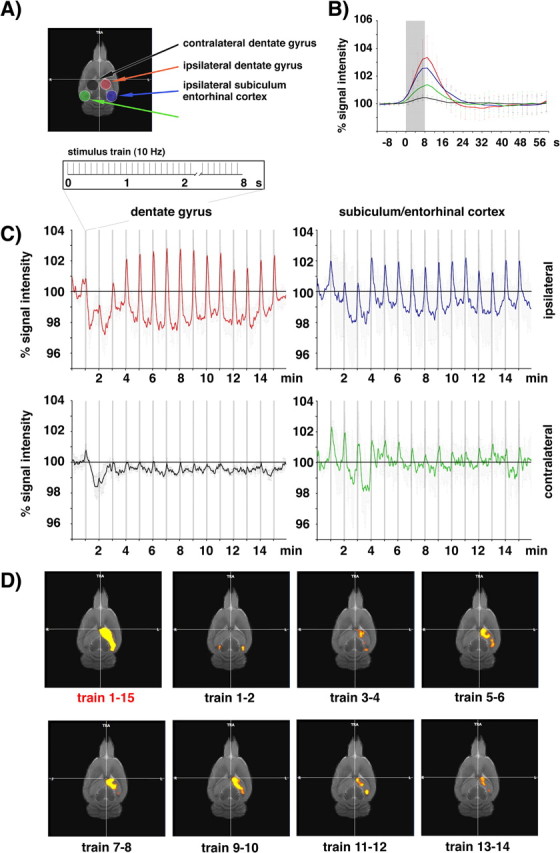
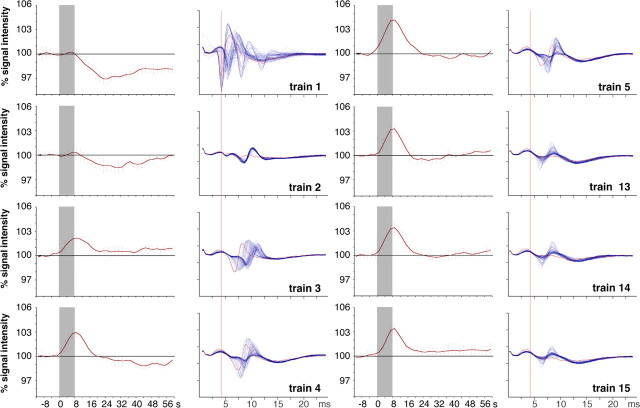
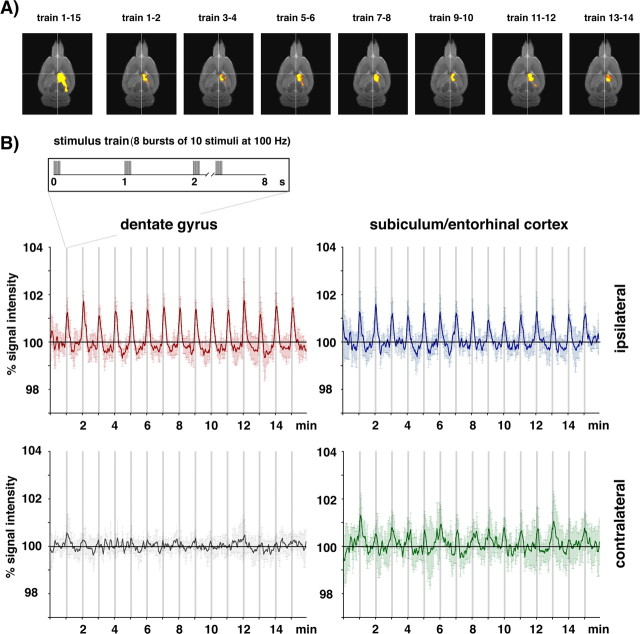
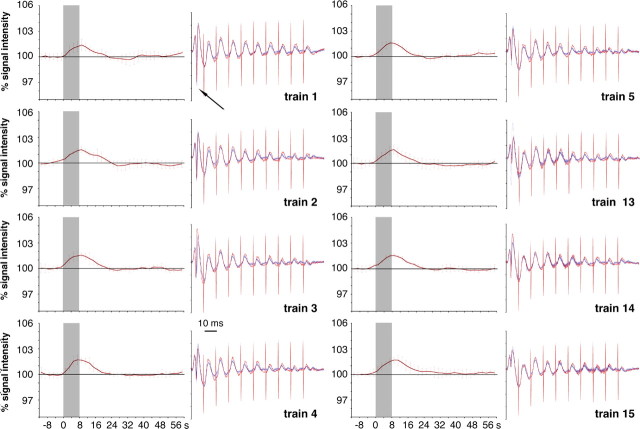
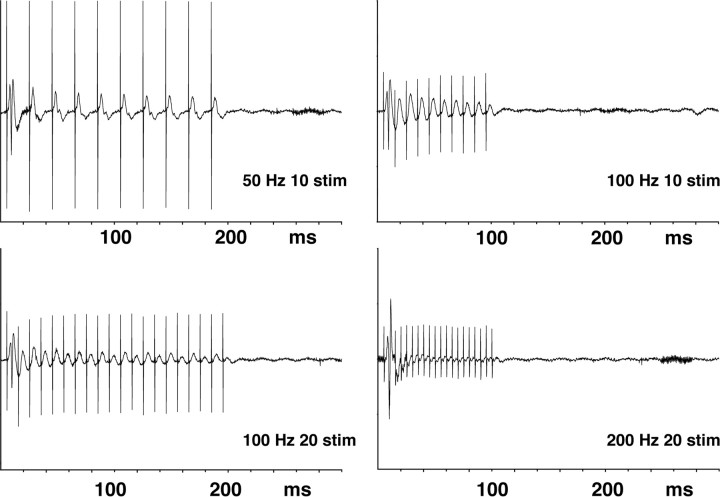
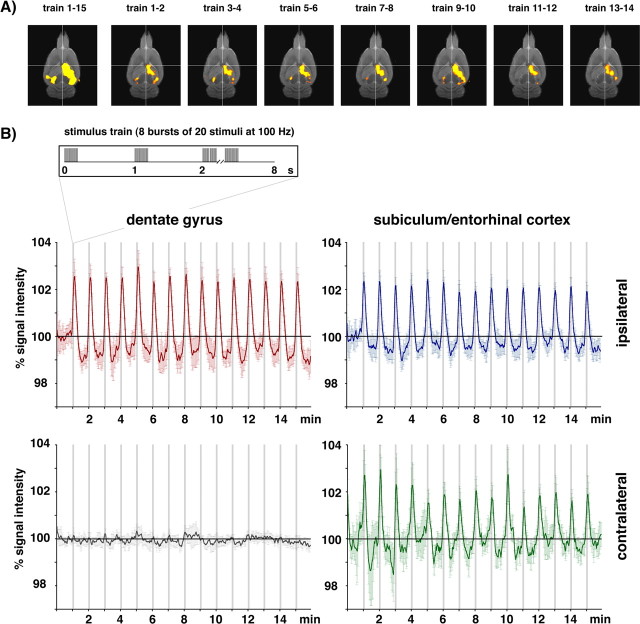
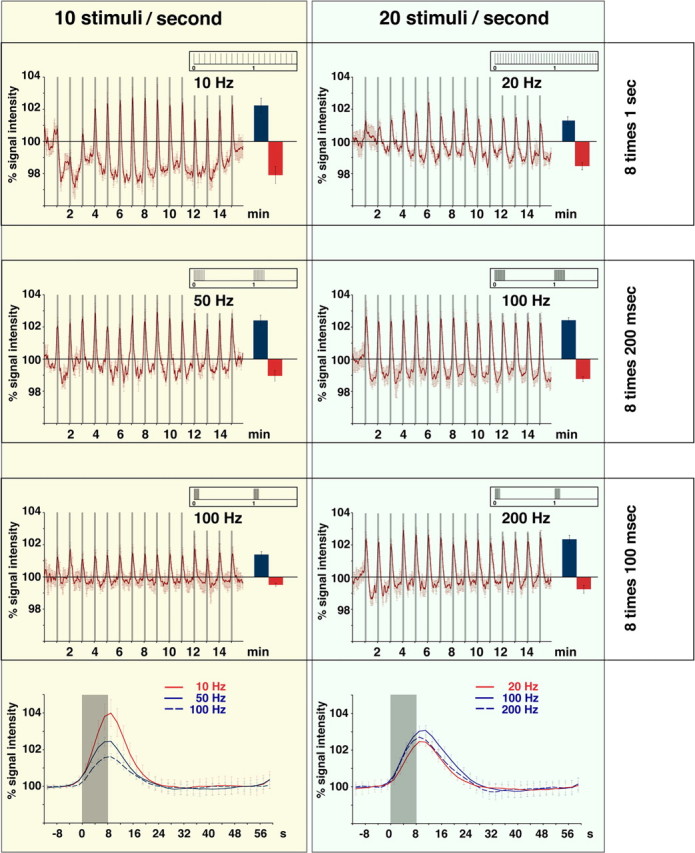
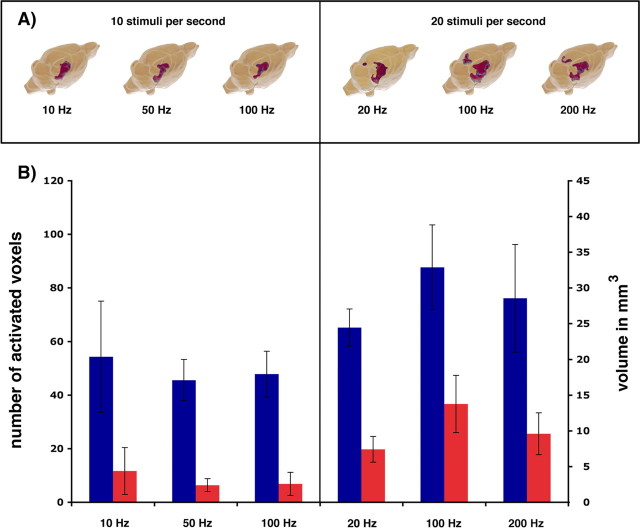
Functional magnetic resonance imaging (fMRI) of the human brain is widely used in neuroscience, but the exact relationship between measured fMRI response and the underlying changes in neuronal activity is still elusive. To obtain further information about the specific roles of synaptic (input) and spiking activity (output) for the generation of fMRI-related signals, we used an approach that combines electrophysiological and MRI measurements in the anatomically and physiologically well defined rat hippocampus. Direct electrical stimulation of the perforant pathway enabled us to control synchronized input activity to the dentate gyrus, whereas recorded population spikes from the granular cell layer indicated the dentate output activity. The perforant pathway was first stimulated with 15 identical pulse trains (10 Hz for 8 s), and evoked blood oxygenation level-dependent (BOLD) responses and population spikes were measured for each individual stimulus train. Spatial and magnitude aspects of the elicited BOLD responses differentially changed in the dentate gyrus and hippocampus from early to late stimulus trains together with population spike latencies in the dentate indicating delayed inhibitory network processing. Furthermore, the same number of stimuli presented in different patterns within trains (i.e., bursts of 10 stimuli at 50, 100, or 200 Hz) clearly altered the BOLD responses. Similarly, variations in the BOLD response also occurred when different stimulus patterns were chosen that caused the same number of population spikes. The results indicate that neuronal network activity including inhibitory interneurons rather than exclusively the input or spiking activity of the principal neurons determine a BOLD response to repetitive stimuli.


Figures

Figure 1.
Figure 1.
Example of an fMRI experiment using chronically implanted electrodes that allowed to stimulate the right perforant pathway and to record the neuronal activity within the dentate gyrus during acquisition of an fMRI data set. A, Electrical activation of the perforant pathway with repetitive stimulus trains (15 trains, 10 Hz for 8 s each, 52 s intertrain interval, 16 min total measuring time) caused a significant BOLD response in the entire ipsilateral hippocampus (t >6.38; p < 4.26 × 10⁻¹⁰). B, By increasing the significance level (t >11.58; p < 1.40 × 10⁻²⁸), two distinct activation areas became detectable, i.e., the dentate gyrus and an area containing the subiculum and the entorhinal cortex region. C, Comparable BOLD time series in the dentate gyrus, defined by the statistical threshold (red) or by anatomical segmentation (blue). Small distortions in the EPI-based fMR images compared with the RARE-based anatomical MR images caused slightly reduced BOLD amplitudes (graphs represent averaged BOLD time series measured in 5 animals).
Figure 2.
Figure 2.
Consecutive identical stimulation trains cause region- and time-specific variations in the BOLD response. A, The hippocampal regions selected for BOLD measurements are depicted in an anatomical MRI (top left). B, Calculation of the average BOLD responses in the ipsilateral dentate gyrus (red line), ipsilateral subiculum/entorhinal cortex (blue line), contralateral subiculum/entorhinal cortex (green line), and contralateral dentate gyrus (black line). Each line represents the average BOLD response to all 15 identical stimulus trains. The gray box indicates the time window of the stimulation train. C, Time-dependent variations in the BOLD responses during electrical stimulation of the right perforant pathway (the stimulation pattern of one train is depicted in the scheme above). Whereas in the ipsilateral subiculum/entorhinal cortex region, clear BOLD responses were detectable during all stimulus trains, obvious BOLD responses in the ipsilateral dentate gyrus became detectable only after the second stimulation train. In contrast, within the contralateral subiculum/entorhinal cortex, significant BOLD responses to the stimulation were only detectable during the initial stimulation trains. No clear positive BOLD responses were observed in the contralateral dentate gyrus region. Each inset represents the averaged BOLD response of five individual animals. D, Calculation of a general linear model of regions with significant stimulus-dependent signal intensity changes revealed a time-dependent variation in the activation pattern. Early stimulation trains (train 1–2) triggered significant BOLD responses only in the ipsilateral and contralateral entorhinal cortex regions. Subsequent stimulation trains caused a spreading of the BOLD response to the entire ipsilateral hippocampus, which was followed by a more focused BOLD response to the dentate gyrus region at the end of the experiment.
Figure 3.
Figure 3.
Comparison of the BOLD response (left columns) and corresponding population spikes (right columns) in the dentate gyrus triggered by individual 10 Hz stimulation trains. During the first stimulation train a delayed reduction in the BOLD signal intensity was observed that coincided with a large variation in the population spike characteristics (amplitude and latency). Starting with the third stimulation train clear positive BOLD responses without a delayed negative component became detectable that corresponded to stable patterns of elicited population spikes. The BOLD responses to individual stimulation trains are depicted as event-related average of all five animals. The gray box indicates the time window of the stimulus train. All 80 measured population spikes within an entire stimulation train are superimposed, and the first population spike is indicated in red. For comparison, the latency of the first population spike within the first stimulation train is indicated by the red vertical line (the measurements are from 1 experiment).
Figure 4.
Figure 4.
Development of the BOLD response during stimulation of the perforant pathway with 15 patterned stimulus trains (8 bursts of 10 stimuli each at 100 Hz). A, Visualization of significant BOLD responses to individual stimulation trains revealed an almost identical pattern during the entire experiment. B, The individual BOLD responses triggered by each individual stimulation train were similar during the entire experiment (graphs represent the average BOLD response measured in 8 animals).
Figure 5.
Figure 5.
Comparison of BOLD responses (left columns) and corresponding population spikes (right columns) in the dentate gyrus caused by repetitive patterned stimulus trains (as in Fig. 4). The high-frequency stimulation of the perforant pathway triggered one initial population spike per burst (black arrow), whereas subsequent stimuli in a burst triggered only detectable field EPSPs with decreasing amplitude (gray arrow). The general activation pattern induced by the bursts did not vary considerably within one train and was also very similar between all consecutive trains. The electrophysiological recordings of the responses to the first burst are shown in red and the subsequent stimulus bursts (2–8 s) in blue. The BOLD response to each individual stimulation train is depicted as event-related average of all eight experiments. The gray box indicates the time window of the stimulus train.
Figure 6.
Figure 6.
Examples of the measured electrophysiological responses after various high-frequency stimulation protocols. During all four stimulation conditions, only a single initial population spike was by the first stimulus pulse per burst, whereas all subsequent stimuli triggered field EPSPs. Consequently, the output activity was comparable in all four experiments leading to eight population spikes per stimulation train.
Figure 7.
Figure 7.
Development of the BOLD response during stimulation of the perforant pathway with repetitive trains with bursts of 20 stimuli at 100 Hz. A, Visualization of significant BOLD responses to individual stimulation trains revealed an almost identical pattern during the entire experiment. In contrast to the stimulus condition 10 stimuli at 100 Hz (Fig. 4), a significant BOLD response was also observed in the contralateral entorhinal cortex region. B, All individual BOLD responses triggered by each stimulation train were similar during the entire experiment (graphs represent the average BOLD response measured in 8 animals).
Figure 8.
Figure 8.
Summary of the generated BOLD responses in the dentate gyrus observed after different protocols of perforant pathway stimulation. In all experiments, the number of stimulus trains (15), the duration of one stimulus train (8 s), the intertrain interval (52 s), and the individual stimulus characteristics [square pulse (0.2 ms) with an intensity that evoked a population spike amplitude of 50% the maximal amplitude] were identical. Left, The stimulation covered always 80 stimuli per train corresponding to a number of 10 stimuli per second but with different frequencies and consequently different temporal pattern. The stimuli were delivered with increasing frequencies. The 10 Hz stimulation protocol (scheme of the stimulus pattern is shown in the insert) caused a clear BOLD response as well as an immediate decline of the baseline signal intensity in the dentate gyrus (blue column indicate the average positive BOLD response, the red column indicates the average decline of the baseline signal intensity between the stimulus trains). Burst stimulation of the perforant pathway with 50 Hz caused a stable BOLD response and a smaller decline in the basal signal intensity during the experiment. In contrast to 10 Hz stimulation, the magnitude of the BOLD response was stable during the experiment. Short bursts of 100 Hz also caused a stable BOLD response, however, with a smaller magnitude and without a decline of the baseline signal intensity. Comparing the averaged BOLD responses (calculated as event-related average) triggered by various frequencies revealed a frequency-dependent reduction in the magnitude. Note that strong decline in basal signal intensities during the 10 Hz stimulation condition caused the strongest BOLD response. Right, Stimulation of the perforant pathway with 160 stimuli per train corresponding to 20 stimuli per second as continuous or as burst stimulation (i.e., 100 or 200 Hz) caused comparable BOLD responses in the dentate gyrus. In contrast to the 10 Hz stimulation protocol, the 20 Hz stimulation protocol induced positive BOLD responses already during the first stimulus trains and a decline in the basal signal intensities developed gradually.
Figure 9.
Figure 9.
Visualization of brain regions that display significant BOLD responses during repetitive electrical stimulations of the perforant pathway. A, 3D reconstruction of all regions showing a significant BOLD response according to a general linear model [left side: 10 stimuli per second, at 10 Hz (n = 5), 50 Hz (n = 6), and 100 Hz (n = 8); right side: 20 stimuli per second at 20 Hz (n = 5), 100 Hz (n = 8), and 200 Hz (n = 7)]. B, The total volume of the activated regions during various stimulation conditions was calculated by counting all voxels showing a significant BOLD response (p < 10−9) (1 voxel equivalent to 0.39 mm3). The results represent averaged volumes (blue columns, right hippocampus and entorhinal cortex regions; red columns, left hippocampus and entorhinal cortex regions) measured in all individual experiments.

Similar articles

Cited by

References

    1. Amaral D, Lavenex P. Hippocampal neuroanatomy. In: Andersen P, Morris R, Amaral D, Bliss T, O'Keefe J, editors. The Hippocampus book. Oxford: Oxford UP; 2007. pp. 37–114.
    1. Angenstein F, Kammerer E, Niessen HG, Frey JU, Scheich H, Frey S. Frequency-dependent activation pattern in the rat hippocampus, a simultaneous electrophysiological and fMRI study. Neuroimage. 2007;38:150–163. - PubMed
    1. Bressler D, Spotswood N, Whitney D. Negative BOLD fMRI response in the visual cortex carries precise stimulus-specific information. PLoS ONE. 2007;2:e410. - PMC - PubMed
    1. Buhl E, Whittington M. Local circuits. In: Andersen P, Morris R, Amaral D, Bliss T, O'Keefe J, editors. The hippocampus book. Oxford: Oxford UP; 2007. pp. 297–319.
    1. Harel N, Lee SP, Nagaoka T, Kim DS, Kim SG. Origin of negative blood oxygenation level-dependent fMRI signals. J Cereb Blood Flow Metab. 2002;22:908–917. - PubMed

Publication types