. 2009 Feb 25;29(8):2486-95.
doi: 10.1523/JNEUROSCI.3898-08.2009.

Distinct subtypes of basolateral amygdala taste neurons reflect palatability and reward

Affiliations

Distinct subtypes of basolateral amygdala taste neurons reflect palatability and reward

Alfredo Fontanini et al. J Neurosci. .

Abstract

The amygdala processes multiple, dissociable properties of sensory stimuli. Given its central location within a dense network of reciprocally connected regions, it is reasonable to expect that basolateral amygdala (BLA) neurons should produce a rich repertoire of dynamical responses to taste stimuli. Here, we examined single BLA neuron taste responses in awake rats and report the existence of two distinct subgroups of BLA taste neurons operating simultaneously during perceptual processing. One neuron type produced long, protracted responses with dynamics that were strikingly similar to those previously observed in gustatory cortex. These responses reflect cooperation between amygdala and cortex for the purposes of processing palatability. A second type of BLA taste neuron may be part of the system often described as being responsible for reward learning: these neurons produced very brief, short-latency responses to rewarding stimuli; when the rat participated in procuring the taste by pressing a lever in response to a tone, however, those phasic taste responses vanished, phasic responses to the tone appearing instead. Our data provide strong evidence that the neural handling of taste is actually a distributed set of processes and that BLA is a nexus of these multiple processes. These results offer new insights into how amygdala imbues naturalistic sensory stimuli with value.


Figures

Figure 1.
Figure 1.
Electrode placement. A sample histology shows placement of the electrode tips. The cannula track is visible extending ventrally from the surface and terminating in the basolateral amygdala. The lesion hole is marked with a black arrow. Asterisks denote the locations of the recording tips for the remaining rats. BLAv, Ventral basolateral amygdala; BM, basomedial amygdala; DEn, dorsal endopiriform nucleus; ec, external capsule; LA, lateral amygdala; pir, piriform cortex.
Figure 2.
Figure 2.
Two types of taste neurons can be observed in BLA. A, Scatterplot showing the response properties of all BLA neurons that responded to taste administration with excitatory changes in firing rate. Each neuron's responses were averaged across tastes (x-axis, average response duration; y-axis, average response onset), such that there is one dot on the graph per neuron. Neurons that appear to cluster together are plotted in the same color. B, The results of a hierarchical cluster analysis on the same data, confirming that BLA taste-responsive neurons, color-coded to match A, come in two types. Note the high intracluster similarity (far-left branching) and low between-cluster similarity. C, Population histograms of the neurons in each cluster, color-coded to match A and B, showing that the responses of LD and SD neurons start at similar magnitudes but quickly diverge. The x-axis is time after delivery (the time of taste delivery is noted with a vertical line), and the y-axis is average firing rate in spikes per second. Error bars (here and in all other figures) are SEM. D, Plot showing, for LD and SD neurons, the average between-taste differences in response. The x-axis is time after delivery, and the y-axis is difference in spikes per second. SD responses to different tastes differ immediately, whereas LD responses to different tastes are similar early and then diverge. *p < 0.05, LD>SD; #p < 0.05, SD>LD.
Figure 3.
Figure 3.
LD neurons produce time-varying taste responses with dynamics similar to those of GC. A, The top halves of each panel are the spiking activity of a representative LD neuron in response to each of the four tastes. Each row is a single trial, and each hash mark is an action potential; the x-axis is time, with 0 being the moment of taste delivery (marked with a vertical line). These plots are summarized below in PSTHs, which show the firing rate (in spikes per second) of the neuron in response to the tastes. Shaded areas indicate periods of firing significantly higher than the prestimulus rate. Note that there is an initial excitatory response to each taste but that the quinine and citric acid responses return quickly to baseline; the sucrose and NaCl responses remain high throughout the first second of the response, and the sucrose response remains high even after the NaCl response has declined. B, Plot showing the percentage of LD neurons (y-axis) that responded to one (blue line), two to three (red line), or all four (green line) tastes in each 250 ms bin of poststimulus time (x-axis). Each category peaks during a distinct epoch of time (neurons are most likely to respond to all 4 tastes early, to 2–3 tastes later, and to 1 taste later still).
Figure 4.
Figure 4.
LD neurons carry palatability-related information in the middle portion of their temporal codes. A, Photographs displaying the stereotyped orofacial reactions to the delivery of a palatable (top; licking to sucrose and NaCl) and unpalatable (bottom; gaping to citric acid and quinine) taste delivery. These responses reveal the perceived palatability of the taste qualities delivered. B, Breakdown of what tastes caused responses during time bins in which neurons responded to two to three tastes. S, Sucrose; N, NaCl; C, citric acid; Q, quinine. Sixty percent of the two to three taste responses were to either S/N (i.e., the pair of palatable tastes) or C/Q (i.e., the pair of unpalatable tastes). That is, with few exceptions (an occasional bin with responses to N/Q), LD neurons responded to tastes with similar palatabilities. C, This graph shows, for each epoch implied in A, the difference (in spikes per second; y-axis) between responses to tastes with similar palatabilities (dark green bars) and different palatabilities (light green bars). During the middle epoch of the response only (the epoch dominated by responses to pairs of tastes), there was much more difference between responses to tastes with different palatabilities (*p < 0.01). FR, Firing rate. D, Template-based classification of LD epoch 2 taste responses shows the actual taste delivered was identifiable (y-axis, percentage correct; x-axis, classification of taste trial) at twice chance (horizontal dashed line) rates. The greatest percentage of errors, consistent across all tastes, was the result of “palatability confusion” (sucrose and NaCl were most often confused for one another, as were citric acid and quinine). For ease of visualization, palatable tastes are in light and dark blue, whereas unpalatable tastes are in light and dark red.
Figure 5.
Figure 5.
SD responses code reward value. A, PSTHs of representative SD responses to all four tastes. Each response is similarly phasic, but the sucrose response is largest, and the quinine response is smallest. Time of taste delivery is marked with a vertical line. B, Another SD neuron (with a just barely >0 baseline firing rate), which responded most strongly to quinine and least strongly to sucrose.
Figure 6.
Figure 6.
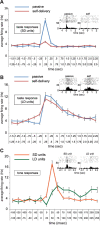
Self-administration affects SD responses but not LD responses. A, The blue line, essentially replicated from Figure 2C, is the population histogram (x-axis, time after delivery in seconds; y-axis, firing rate in spikes per second) for SD neurons in response to taste stimuli. The red line shows the population histogram for the same neurons during self-administration of the same tastes. Self-administration had little impact on activity before taste delivery and all but eliminated the taste responses themselves. The insets show an example of a single SD response to experimenter-administrated (left) and self-administrated (right) sucrose (x-axis, time in seconds; y-axis, firing rate in spikes per second). Time of taste delivery is marked with a vertical line. B, Similar population histograms (blue line, experimenter administration; red line, self-administration) for LD neurons. There was no difference in the taste responses themselves, but a significant anticipatory response preceded self-administration. The insets show representative example responses. See Results for statistical details. C, Population histogram for all LD (green line) and SD (orange line) units in the time period immediately surrounding tone onset before self-administration. x-axis, Time in milliseconds; y-axis, firing rate in spikes per second. SD units show fast, phasic response to tone peaking between 25 and 50 ms. LD units show more gradual, lower-amplitude tone responses.
Figure 7.
Figure 7.
Comparison of results from cortical and LD neurons suggests amygdala–cortical coupling. A schematic of the time courses (x-axis, time after delivery in seconds) of the taste responses observed previously (Katz et al., 2001a) in taste cortex (top) and in LD neurons (bottom) is shown. The two progress through a similarly timed sequence of three response “epochs”: one lasting until ∼0.25 s, a second lasting from ∼0.25 to ∼1.0 s, and a third beginning at 1.0 s after taste administration. The first epoch appears largely identical for LD and cortical neurons; both provide information about the presence of a taste on the tongue (“Detection”) but neither provides discriminative information about which taste is which. Information about palatability is available in LD neurons during the second epoch, whereas cortex conveys information about the identity of the taste regardless of its palatability (i.e., responses to palatability-specific pairs of tastes are not particularly similar). Finally, in the third epoch, palatability-related information appears in cortex, perhaps reflecting transmission from BLA. The third epoch of LD BLA responses remains mysterious at this time.

Similar articles

Cited by

References

    1. Ahn S, Phillips AG. Modulation by central and basolateral amygdalar nuclei of dopaminergic correlates of feeding to satiety in the rat nucleus accumbens and medial prefrontal cortex. J Neurosci. 2002;22:10958–10965. - PMC - PubMed
    1. Balleine BW, Killcross AS, Dickinson A. The effect of lesions of the basolateral amygdala on instrumental conditioning. J Neurosci. 2003;23:666–675. - PMC - PubMed
    1. Bauman ML, Kemper TL. The neuropathology of the autism spectrum disorders: what have we learned? Novartis Found Symp. 2003;251:112–122. discussion 122–128, 281–297. - PubMed
    1. Belova MA, Paton JJ, Morrison SE, Salzman CD. Expectation modulates neural responses to pleasant and aversive stimuli in primate amygdala. Neuron. 2007;55:970–984. - PMC - PubMed
    1. Bermpohl F, Pascual-Leone A, Amedi A, Merabet LB, Fregni F, Gaab N, Alsop D, Schlaug G, Northoff G. Dissociable networks for the expectancy and perception of emotional stimuli in the human brain. Neuroimage. 2006;30:588–600. - PubMed

Publication types

MeSH terms

LinkOut - more resources