. 2009 Feb 25;29(8):2510-8.
doi: 10.1523/JNEUROSCI.5333-08.2009.

L-type calcium channels govern calcium signaling in migrating newborn neurons in the postnatal olfactory bulb

Affiliations

L-type calcium channels govern calcium signaling in migrating newborn neurons in the postnatal olfactory bulb

Daniel P Darcy et al. J Neurosci. .

Abstract

Newborn inhibitory neurons migrate into existing neural circuitry in the olfactory bulb throughout the lifetime of adult mammals. While many factors contribute to the maturation of neural circuits, intracellular calcium is believed to play an important role in regulating cell migration and the development of neural systems. However, the factors underlying calcium signaling within newborn neurons in the postnatal olfactory bulb are not well understood. Here, we show that migrating, immature neurons in the olfactory bulb subependymal layer (SEL) undergo spontaneous and depolarization-evoked intracellular calcium transients mediated by high-voltage-activated L-type calcium channels. In contrast to migrating immature neurons in other brain regions, modulation of calcium transients in SEL cells does not alter their rate of migration.


Figures

Figure 1.
Figure 1.
Migration route and molecular identity of NPCs in the postnatal olfactory bulb. A, Tangential migration of NPCs from their site of proliferation in the SVZ, through the RMS and into the SEL of the olfactory bulb (OB). Box shows area imaged for migration experiments. AOB, Accessory olfactory bulb; CC, corpus callosum; CTX, cortex; LV, lateral ventricle. B, C, DIC (B) and GFP (C) fluorescence images of a field of NPCs from a GFP-doublecortin transgenic mouse.
Figure 2.
Figure 2.
Membrane properties and L-type Ca2+ currents in NPCs of the olfactory bulb SEL. A1, Membrane potential of an NPC (bottom) in response to step injections of current (top). A2, Voltage-clamp recording (top; Vm = −80 mV) of an NPC with mixed Na+ (filled circle) and K+ current (open circle). A3, Summary IV plot of early (filled circles) and late currents (open circles, n = 8 cells). Inset, early currents shown expanded from A2. B1, Example traces of a regenerative spike elicited by small current injections in an NPC in the presence of TTX and TEA. B2, Example traces of Ca2+ currents elicited by voltage-steps and B3, summary IV plot of HVA Ca2+ channel activity (n = 7 cells). C, Representative experiments showing NPC Ca2+ current blocked by nimodipine (C1, 20 μm) and enhanced by BayK 8644 (C2, 10 μm). C3, Summary of the effects of nimodipine (n = 6) and BayK 8644 (n = 6) on NPC Ca2+ current. Asterisks indicate significantly different from control.
Figure 3.
Figure 3.
Spontaneous Ca2+ transients in NPCs in the olfactory bulb. A1, Fluorescence image of NPCs in an acute rat bulb slice loaded with OG1-AM. Circular ROIs are centered on five individual cells. A2, Delta F/F traces of average changes in fluorescence intensity within each ROI in A1. A3, Top, Trace of aligned and averaged spontaneous Ca2+ transients (n = 133). Bottom, Histograms of unitary transient rise (thin trace) and decay (thick trace) times. B1, Ca2+ transient frequency is unaffected by coapplication of TTX (1 μm), NBQX (20 μm), APV (50 μm) and gabazine (25 μm). Top, Traces from a representative cell before and after application of blockers. Bottom, Summary results of transient frequency under control conditions and after drug application for individual cells (n = 30 cells, 3 slices). B2, Thapsigargin does not alter the frequency of Ca2+ transients. Example traces (top) and frequency of transients (bottom) during control conditions and after application of thapsigargin (5–10 μm, n = 46 cells, 5 slices). B3, Membrane depolarization increases the frequency of Ca2+ transients. Example traces (top) and transient frequency (bottom) during control conditions and after application of aCSF containing 10 mm K+ (n = 57 cells, 3 slices).
Figure 4.
Figure 4.
Spontaneous Ca2+ transients require Ca2+ influx and are mediated by L-type Ca2+ channels. A1, Top, Example widefield delta F/F time projections demonstrating NPC transient activity under control conditions, in the presence of nominally Ca2+-free, and after wash. Scale bar, 20 μm. Bottom, Traces from ROIs centered over the 3 cells during each condition. A2, Summary of transient frequency (n = 116 cells, 4 slices). B1, Top, Example widefield delta F/F time projections of transients under control conditions, after application of nimodipine, and subsequent wash-in of BayK 8644. Scale bar, 20 μm. Bottom, Traces from ROIs centered over 3 cells during each condition. B2, Average change in Ca2+ transient frequency in response to nimodipine and BayK 8644 (control: 0.45 ± 0.07, nimodipine: 0.10 ± 0.03, BayK: 1.22 ± 0.12; n = 60 cells, 4 slices).
Figure 5.
Figure 5.
Depolarization-evoked Ca2+ transients in NPCs in the olfactory bulb mediated by L-type Ca2+ channels. A1, Delta F/F image of SEL NPCs before and after focal application of 45 mm K+. A2, Evoked responses from several individual NPCs in A1 under control conditions, after application of nimodipine, and subsequent washout of nimodipine with BayK 8644.
Figure 6.
Figure 6.
Quantifying NPC migration in olfactory bulb slices. A1, Example migration experiment showing NPCs focally labeled with CellTracker Green CMFDA. A2, Inset showing migration path or celltracks for 2 NPCs (red arrows). B, Total distance plotted for the 2 NPCs in A2 demonstrating gradual movement interspersed with larger translocations of the soma.
Figure 7.
Figure 7.
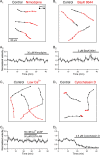
Effects of Ca2+-channel manipulation on migration of NPCs. A1, Example celltracks of NPCs migrating under control conditions (black) and in the presence of nimodipine (red). A2, Average time course of migration with bath application of nimodipine (n = 47 cells, 3 slices). B1, Example celltracks of migration under control conditions (black) and during exposure to BayK 8644 (red). B2, Average time course of migration with application of BayK 8644 (n = 47 cells, 4 slices). C1, Example celltracks of migration under control conditions (black) and after wash-in of aCSF containing 60 nm Ca2+ and 50 μm EGTA-AM (red). C2, Average time course of migration during application of nominally Ca2+-free aCSF and EGTA-AM (n = 23 cells, 1 slice). D1, Example celltracks of migration under control conditions (black) and during exposure to cytochalasin D (red). D2, Average time course of migration with application of cytochalasin D (n = 50 cells, 2 slices).

References

    1. Alonso M, Viollet C, Gabellec MM, Meas-Yedid V, Olivo-Marin JC, Lledo PM. Olfactory discrimination learning increases the survival of adult-born neurons in the olfactory bulb. J Neurosci. 2006;26:10508–10513. - PMC - PubMed
    1. Baker H, Liu N, Chun HS, Saino S, Berlin R, Volpe B, Son JH. Phenotypic differentiation during migration of dopaminergic progenitor cells to the olfactory bulb. J Neurosci. 2001;21:8505–8513. - PMC - PubMed
    1. Belluzzi O, Benedusi M, Ackman J, LoTurco JJ. Electrophysiological differentiation of new neurons in the olfactory bulb. J Neurosci. 2003;23:10411–10418. - PMC - PubMed
    1. Bolteus AJ, Bordey A. GABA release and uptake regulate neuronal precursor migration in the postnatal subventricular zone. J Neurosci. 2004;24:7623–7631. - PMC - PubMed
    1. Bolteus AJ, Garganta C, Bordey A. Assays for measuring extracellular GABA levels and cell migration rate in acute slices. Brain Res Brain Res Protoc. 2005;14:126–134. - PubMed

Publication types

MeSH terms

Substances

LinkOut - more resources