

At immature mossy-fiber-CA3 synapses, correlated presynaptic and postsynaptic activity persistently enhances GABA release and network excitability via BDNF and cAMP-dependent PKA
- PMID: 19244539
- PMCID: PMC6666235
- DOI: 10.1523/JNEUROSCI.5019-08.2009
At immature mossy-fiber-CA3 synapses, correlated presynaptic and postsynaptic activity persistently enhances GABA release and network excitability via BDNF and cAMP-dependent PKA
Abstract
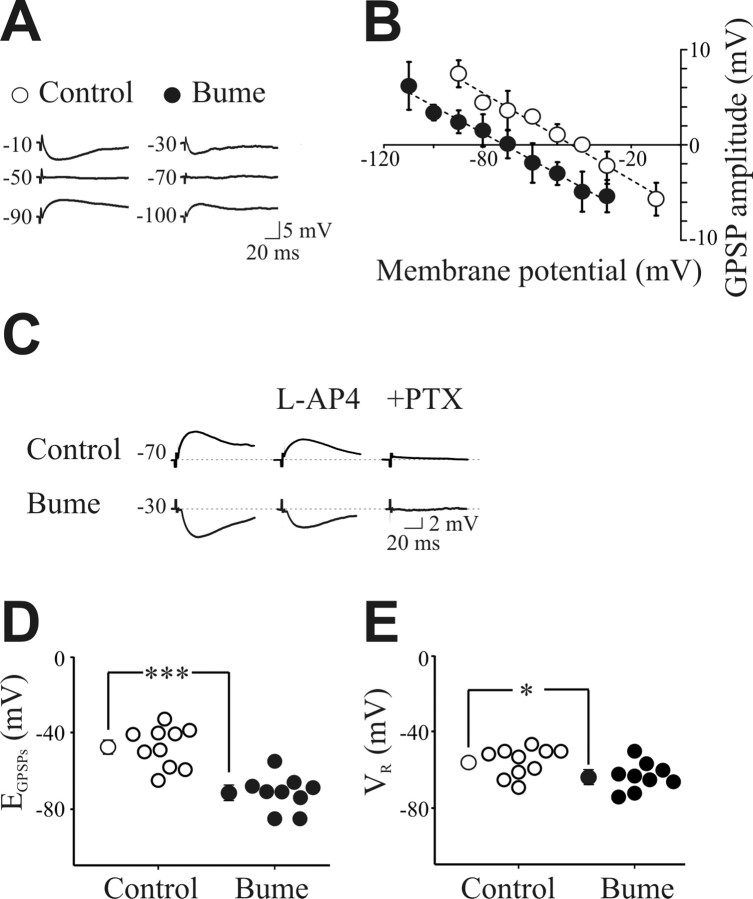
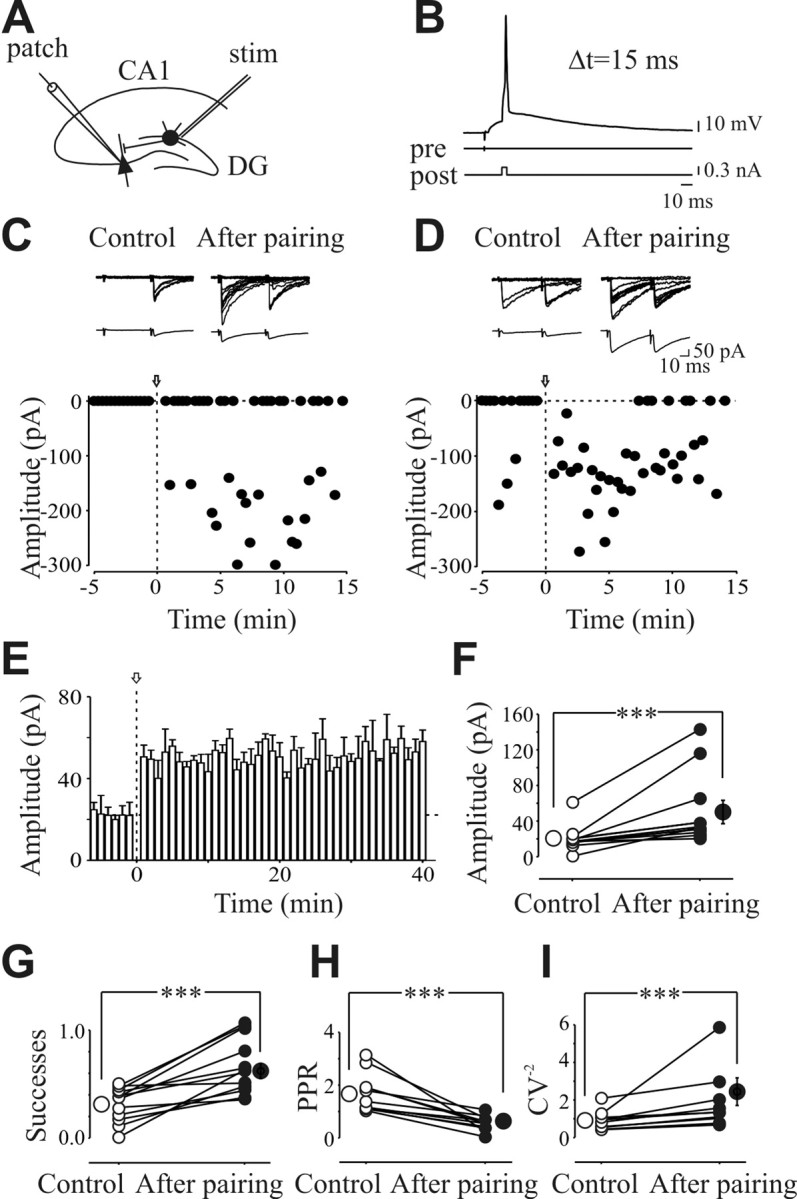
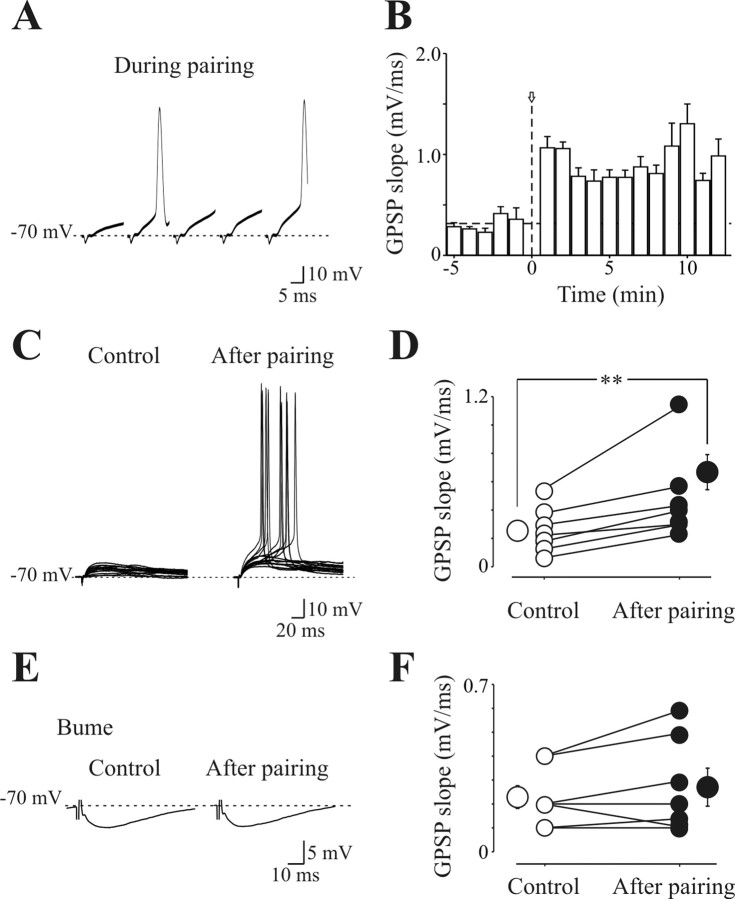
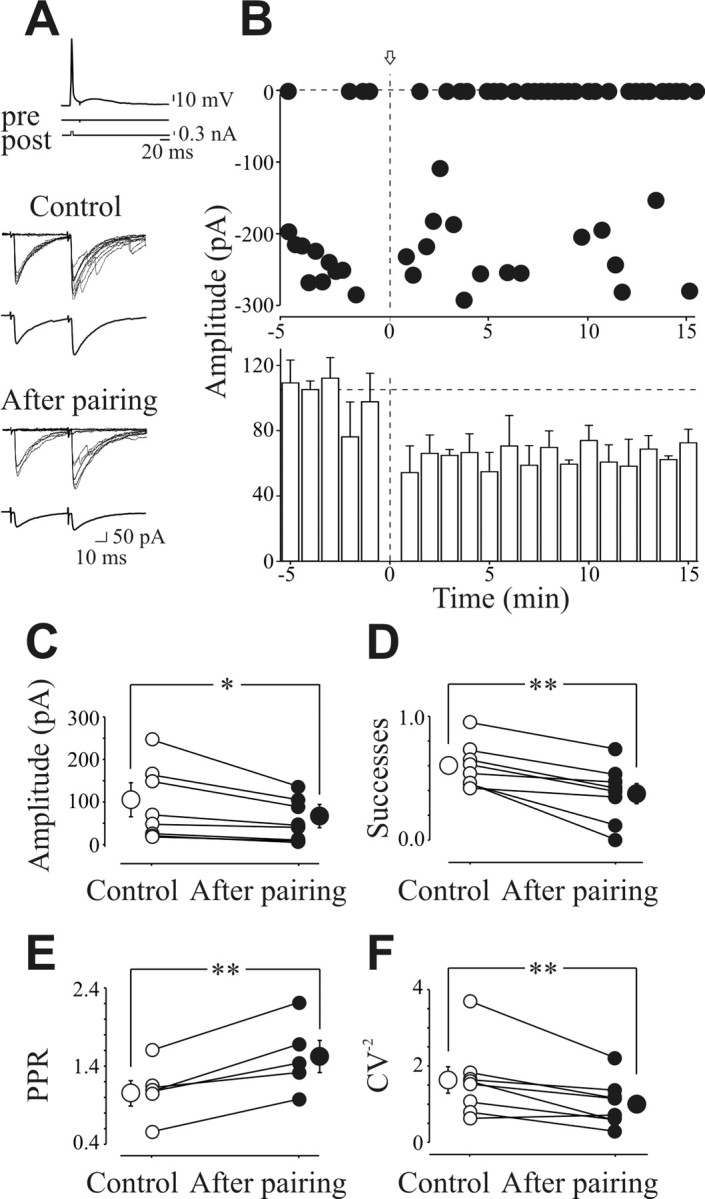
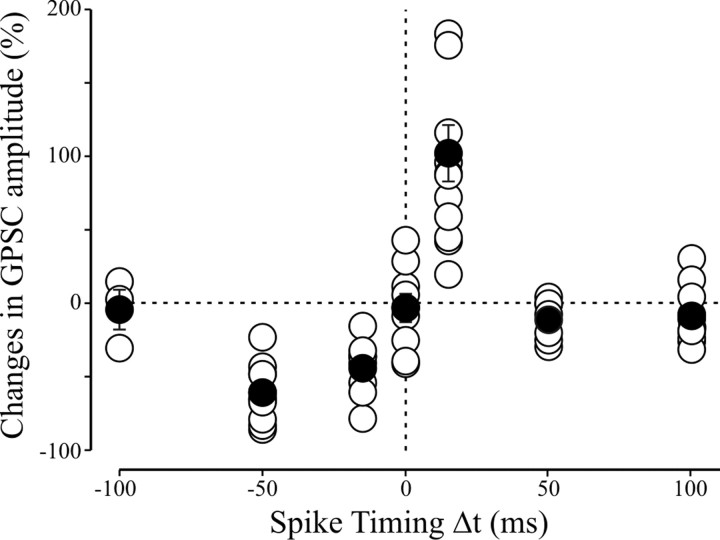
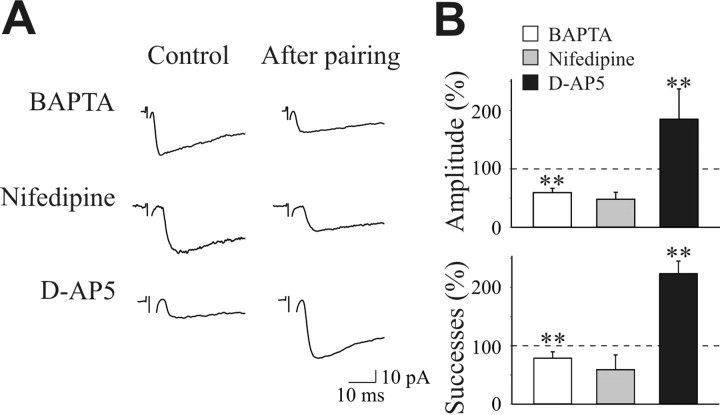
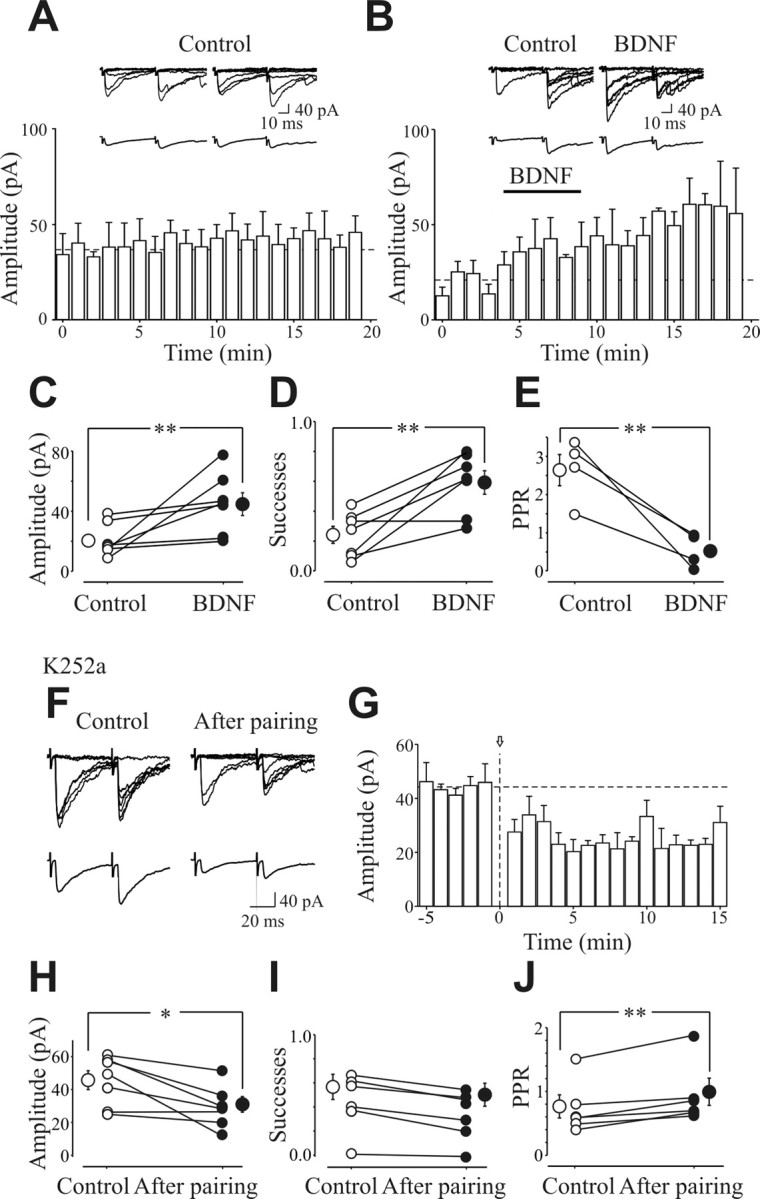
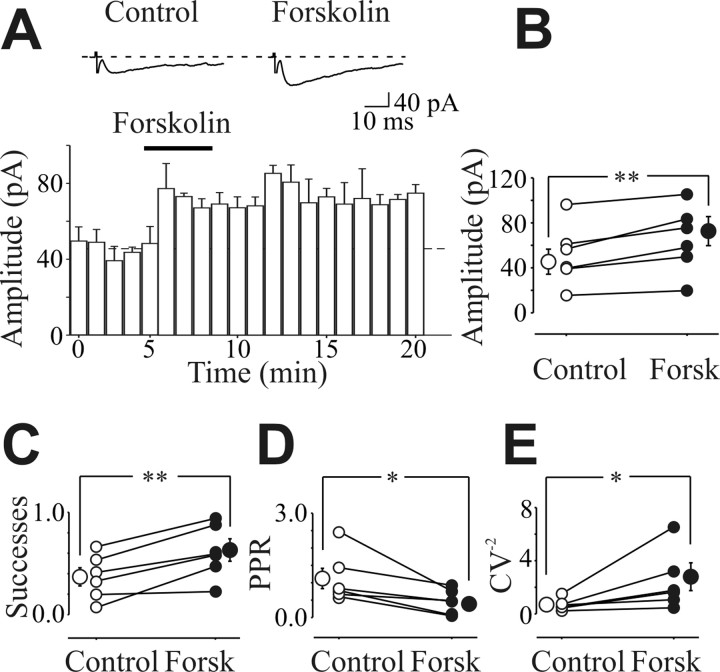
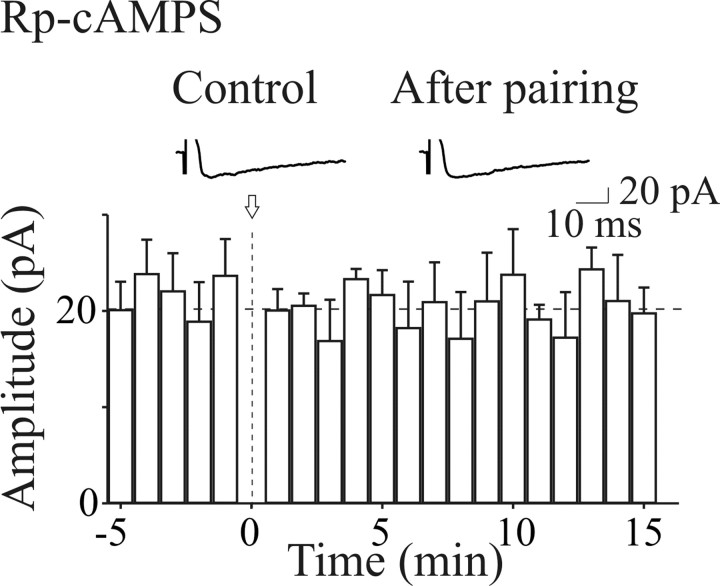
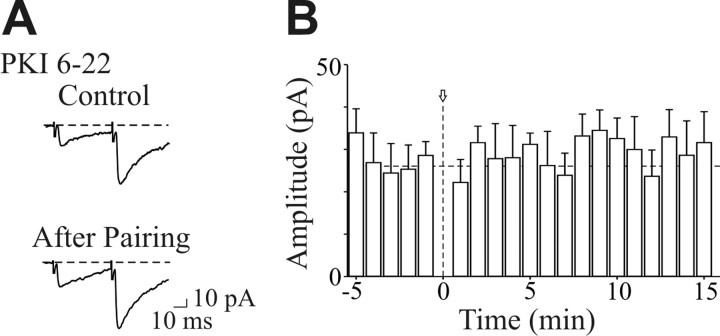
In the adult rat hippocampus, the axons of granule cells in the dentate gyrus, the mossy fibers (MF), form excitatory glutamatergic synapses with CA3 principal cells. In neonates, MF release into their targets mainly GABA, which at this developmental stage is depolarizing. Here we tested the hypothesis that, at immature MF-CA3 synapses, correlated presynaptic [single fiber-evoked GABA(A)-mediated postsynaptic potentials (GPSPs)] and postsynaptic activity (back propagating action potentials) may exert a critical control on synaptic efficacy. This form of plasticity, called spike-timing-dependent plasticity (STDP), is a Hebbian type form of learning extensively studied at the level of glutamatergic synapses. Depending on the relative timing, pairing postsynaptic spiking and single MF-GPSPs induced bidirectional changes in synaptic efficacy. In case of positive pairing, spike-timing-dependent-long-term potentiation (STD-LTP) was associated with a persistent increase in GPSP slope and in the probability of cell firing. The transduction pathway involved a rise of calcium in the postsynaptic cell and the combined activity of cAMP-dependent PKA (protein kinase A) and brain-derived neurotrophic factor (BDNF). Retrograde signaling via BDNF and presynaptic TrkB receptors led to a persistent increase in GABA release. In "presynaptically" silent neurons, the enhanced probability of GABA release induced by the pairing protocol, unsilenced these synapses. Shifting E(GABA) from the depolarizing to the hyperpolarizing direction with bumetanide failed to modify synaptic strength. Thus, STD-LTP of GPSPs provides a reliable way to convey information from granule cells to the CA3 associative network at a time when glutamatergic synapses are still poorly developed.
Figures
Comment in
-
Spike-timing-dependent plasticity induces presynaptic changes at immature hippocampal mossy fiber synapses.J Neurosci. 2009 Jul 1;29(26):8299-301. doi: 10.1523/JNEUROSCI.1997-09.2009. J Neurosci. 2009. PMID: 19571120 Free PMC article. Review. No abstract available.
Similar articles
-
Role of giant depolarizing potentials in shaping synaptic currents in the developing hippocampus.Crit Rev Neurobiol. 2006;18(1-2):13-23. doi: 10.1615/critrevneurobiol.v18.i1-2.30. Crit Rev Neurobiol. 2006. PMID: 17725505 Review.
-
GABA(B) receptor activation mediates frequency-dependent plasticity of developing GABAergic synapses.Nat Neurosci. 2008 Dec;11(12):1410-8. doi: 10.1038/nn.2215. Epub 2008 Oct 26. Nat Neurosci. 2008. PMID: 18953347
-
Long-term potentiation selectively expressed by NMDA receptors at hippocampal mossy fiber synapses.Neuron. 2008 Jan 10;57(1):108-20. doi: 10.1016/j.neuron.2007.11.024. Neuron. 2008. PMID: 18184568 Free PMC article.
-
Photolysis of postsynaptic caged Ca2+ can potentiate and depress mossy fiber synaptic responses in rat hippocampal CA3 pyramidal neurons.J Neurophysiol. 2004 Apr;91(4):1596-607. doi: 10.1152/jn.01073.2003. Epub 2003 Nov 26. J Neurophysiol. 2004. PMID: 14645386 Free PMC article.
-
In the developing hippocampus kainate receptors control the release of GABA from mossy fiber terminals via a metabotropic type of action.Adv Exp Med Biol. 2011;717:11-26. doi: 10.1007/978-1-4419-9557-5_2. Adv Exp Med Biol. 2011. PMID: 21713663 Review.
Cited by
-
The etiological contribution of GABAergic plasticity to the pathogenesis of neuropathic pain.Mol Pain. 2019 Jan-Dec;15:1744806919847366. doi: 10.1177/1744806919847366. Mol Pain. 2019. PMID: 30977423 Free PMC article. Review.
-
Brain is modulated by neuronal plasticity during postnatal development.J Physiol Sci. 2021 Nov 17;71(1):34. doi: 10.1186/s12576-021-00819-9. J Physiol Sci. 2021. PMID: 34789147 Free PMC article. Review.
-
Critical involvement of postsynaptic protein kinase activation in long-term potentiation at hippocampal mossy fiber synapses on CA3 interneurons.J Neurosci. 2010 Feb 24;30(8):2844-55. doi: 10.1523/JNEUROSCI.5269-09.2010. J Neurosci. 2010. PMID: 20181582 Free PMC article.
-
Spike timing-dependent plasticity at GABAergic synapses in the ventral tegmental area.J Physiol. 2013 Oct 1;591(19):4699-710. doi: 10.1113/jphysiol.2013.257873. Epub 2013 Jul 29. J Physiol. 2013. PMID: 23897235 Free PMC article.
-
Spike-timing-dependent plasticity in hippocampal CA3 neurons.J Physiol. 2010 Nov 15;588(Pt 22):4475-88. doi: 10.1113/jphysiol.2010.198366. Epub 2010 Sep 27. J Physiol. 2010. PMID: 20876200 Free PMC article.
References
-
- Aguado F, Carmona MA, Pozas E, Aguiló A, Martínez-Guijarro FJ, Alcantara S, Borrell V, Yuste R, Ibañez CF, Soriano E. BDNF regulates spontaneous correlated activity at early developmental stages by increasing synaptogenesis and expression of the K+/Cl- cotransporter KCC2. Development. 2003;130:1267–1280. - PubMed
-
- Balena T, Woodin MA. Coincident pre- and postsynaptic activity downregulates NKCC1 to hyperpolarize E(Cl) during development. Eur J Neurosci. 2008;27:2402–2412. - PubMed
-
- Ben-Ari Y. Excitatory action of GABA during development: the nature of the nurture. Nat Rev Neurosci. 2002;3:728–739. - PubMed
Publication types
MeSH terms
Substances
LinkOut - more resources
Full Text Sources
Research Materials
Miscellaneous