. 2009 May;234(5):582-94.
doi: 10.3181/0810-RM-312. Epub 2009 Feb 25.

Heme oxygenase-1 inhibits pro-oxidant induced hypertrophy in HL-1 cardiomyocytes

Affiliations

Heme oxygenase-1 inhibits pro-oxidant induced hypertrophy in HL-1 cardiomyocytes

Keith R Brunt et al. Exp Biol Med (Maywood). 2009 May.

Abstract

Aims: Reactive oxygen species (ROS) activate multiple signaling pathways involved in cardiac hypertrophy. Since HO-1 exerts potent antioxidant effects, we hypothesized that this enzyme inhibits ROS-induced cardiomyocyte hypertrophy.

Methods: HL-1 cardiomyocytes were transduced with an adenovirus constitutively expressing HO-1 (AdHO-1) to increase basal HO-1 expression and then exposed to 200 microM hydrogen peroxide (H2O2). Hypertrophy was measured using 3H-leucine incorporation, planar morphometry and cell-size by forward-scatter flow-cytometry. The pro-oxidant effect of H2O2 was assessed by redox sensitive fluorophores. Inducing intracellular redox imbalance resulted in cardiomyocyte hypertrophy through transactivation of nuclear factor kappa B (NF-kappaB).

Results: Pre-emptive HO-1 overexpression attenuated the redox imbalance and reduced hypertrophic indices. This is the first time that HO-1 has directly been shown to inhibit oxidant-induced cardiomyocyte hypertrophy by a NF-kappaB-dependent mechanism.

Conclusion: These results demonstrate that HO-1 inhibits pro-oxidant induced cardiomyocyte hypertrophy and suggest that HO-1 may yield therapeutic potential in treatment of.


Figures

Figure 1
Figure 1
Hydrogen peroxide results in perturbed redox imbalance in HL-1 cardiomyocytes. A) Representative images of control (left panel) and 200 μM H2O2 treated HL-1 cardiomyocytes (right panel) using the ROS-sensitive green CM-H2DCFDA fluorescence (×200) and B) mean intensity between two groups. C) Representative images of control (left panel) and 200 μM H2O2 treated HL-1 cardiomyocytes (right panel) using the ROS-sensitive red DHE (×200). D) Mean intensity of fluorochrome between two groups. (Values are mean ± SEM; * P < 0.05 vs. Vehicle control; FACS analysis was performed in triplicate with a minimum of >10,000 gated cells used to calculate the average log intensity of each replicate in an experiment; the indicated mean is the calculated mean of average log intensities of four independent experiments; N = 4.)
Figure 2
Figure 2
Redox imbalance in HL-1 cardiomyocytes results in cellular hypertrophy indicated by increased cell area and cell volume, with no appreciable alteration in nuclear volume. A) Control (left panel) and treated with 200 μM H2O2 (right panel) showing increased cell surface area (dotted lines) with no change in nuclear size (solid lines). B) Increased quantitative planar morphometry between groups. C) Representative forward-scatter histograms of cardiomyocyte cell volume in control (left panel) and treated with 200 μM H2O2 (right panel) values are presented as an increase from control in total Ln-Mean forward scatter. (Values are mean ± SEM; * P < 0.05 vs. Vehicle control; B) N = mean area of replicates, with >100 cells measured per replicate, total independent experiments are N ≥20; D) N = average Ln-forward-scatter FACS analysis of >10,000 live gated cells per sample, prepared in triplicate, as before; total independent experiments are N = 5).
Figure 3
Figure 3
HL-1 cardiomyocytes control (A–C) and treated with 200 μM H2O2 (D–F) Hoechst nuclear counterstain (blue A, D) and sarcomeric actin staining by phalloidin (red B, E) with merged images (C, F at ×400) demonstrated abundant protein synthesis of alter phenotype of hypertrophied HL-1 cardiomyocytes. Protein synthesis was further quantified by 3H-leucine incorporation (G) as a standardized quantitative index of cellular growth associated with hypertrophy. (Values are mean ± SD; * P ≤0.05 vs. Vehicle control; G) N = replicates individually normalized to total protein from five independent experiments; N ≥20).
Figure 4
Figure 4
Specific expression and activity of HO-1 is achieved using adenoviral vectors. A) Transduction of HO-1 to HL-1 cardiomyocytes (phase) with adenoviral vectors produced >90% transduction efficiency as assessed by (B) GFP green fluorescence (×200). C) HO-1, HO-2 and Actin Protein expression in untransduced 30MOI AdGFP and AdHO-1 demonstrating high levels of HO-1 protein expression without affecting HO-2. D) HO-1 protein expression corresponds to increased basal HO activity. (Values are mean ± SD, results are replicates of a single same day experiment performed in left to right succession of groups; N = 6; *** P ≤0.001 vs. Control).
Figure 5
Figure 5
HO-1 therapy ameliorates redox imbalance and cellular hypertrophy. A) Representative images of ROS accumulation by DHE in vehicle (left panel), AdGFP treated with 200 μM H2O2 (center panel) and AdHO-1 treated with 200 μM H2O2 (right panel; ×200). B) Mean intensity of fluorochrome; AdHO-1 attenuates ROS accumulation. C) Representative forward scatter histograms of control HL-1 cardiomyocytes (left panel) control vector AdGFP treated with 200 μM H2O2 (center panel) and AdHO-1 treated with 200 μM H2O2 (right panel); AdHO-1 attenuates 200 μM H2O2 induced increase in three dimensional cell size. D) Cell surface area and (E) 3H-Luecine incorporation increased by treatment with 200 μM H2O2 in AdGFP is markedly reduced by AdHO-1, respectively. (Values are mean ± SEM; * P ≤0.05, *** P ≤0.001 vs. Vehicle control, # P < 0.05, ### P ≤0.001 vs. AdGFP 200 μM H2O2; A–D) N = mean of triplicate samples for each experiment. Total independent experiments are B) N = 4; D) N ≥5; E) Values are mean ± SD, N = replicates individually normalized to total protein from five independent experiments; N ≥20).
Figure 6
Figure 6
Oxidant-induced hypertrophy occurs by an NF-κB transactivation dependent mechanism. A) Four repeats of the NF-κB consensus promoter sequence upstream of a luciferase reporter measured an increase in promoter activation after treatment with 200 μM H2O2. B) Nuclear protein extract demonstrated active on-target nuclear binding of NF-κB protein after treatment with 200 μM H2O2. C) Increased 3H-Leucine incorporation by 200 μM H2O2 is abrogated by inhibition of NF-κB transactivation with an NF-κB translocation inhibitor SN-50. (Values are mean ± SEM; * P ≤0.05, *** P ≤0.001 vs. Vehicle control, # P ≤0.05, ## P ≤0.01 vs. 200 μM H2O2; A–B) N = mean of duplicate samples as before for each experiment, total independent experiments are A) N ≥8; B) N ≥6; analysis of total samples in B) were performed same day by ELISA from frozen stored isolates; C) Values are mean ± SD, N = replicates individually normalized to total protein from three independent experiments; N = 9).
Figure 7
Figure 7
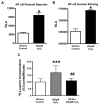
Specific expression of HO-1 ameliorates the oxidative stress induced NF-κB transactivation. A) Promoter activity after 200 μM H2O2 is reduced by HO-1 treatment. B) Nuclear protein NF-κB binding activity after 200 μM H2O2 is also reduced by HO-1 treatment. (Values are mean ± SEM; * P ≤0.05 vs. Vehicle control, # P ≤0.05 vs. 200 μM H2O2; N = mean of duplicate samples as before for each experiment, total independent experiments are A) N ≥7; B) N ≥15; analysis of B is from frozen isolates and two ELISA sets of the same lot were performed on alternate days for analysis.)
Figure 8
Figure 8
Model of HO-1 mediated antihypertrophic effect in HL-1 cardiomyocytes. Redox imbalance in cardiomyocytes activates IKK to phosphorylate IkB, causing its dissociation from NF-κB thereby exposing the nuclear localization signal. Translocation of NF-κB results in the activation of the hypertrophic gene program, thus leading to increased protein synthesis, a consequence related to increased sarcomere formation that ultimately causes cardiomyocyte hypertrophy. HO-1 interrupts this pathway by abrogating NF-κB transactivation, in part through a reduction in excessive ROS accumulation. (HO-1, heme oxygenase-1; BVR, biliverdin reductase; ROS, reactive oxygen species; IKK, IkB kinase; IkB, inhibitor of kappa B; NF-κB, nuclear factor kappa B; SN-50 inhibitor of NF-κB translocation).

Similar articles

Cited by

References

    1. Frey N, Olson EN. Cardiac hypertrophy: the good, the bad and the ugly. Ann Rev Physiol. 2002;65:45–79. - PubMed
    1. Swynghedauw B. Molecular mechanisms of myocardial remodeling. Physiol Rev. 1999;79:215–262. - PubMed
    1. Giordano FJ. Oxygen, oxidative stress, hypoxia and heart failure. J Clin Invest. 2005;115:500–508. - PMC - PubMed
    1. Sawyer DB, Siwik DA, Xiao L, Pimentel DR, Singh K, Colucci WS. Role of oxidative stress in myocardial hypertrophy and failure. J Mol Cell Cardiol. 2002;34:379–388. - PubMed
    1. Lang D. Cardiac hypertrophy and oxidative stress: a leap of faith or stark reality? Heart. 2002;87:316–318. - PMC - PubMed

Publication types