. 2009 Mar 17;106(11):4483-8.
doi: 10.1073/pnas.0813213106. Epub 2009 Feb 25.

Mechanisms contributing to synaptic Ca2+ signals and their heterogeneity in hair cells

Affiliations

Mechanisms contributing to synaptic Ca2+ signals and their heterogeneity in hair cells

Thomas Frank et al. Proc Natl Acad Sci U S A. .

Abstract

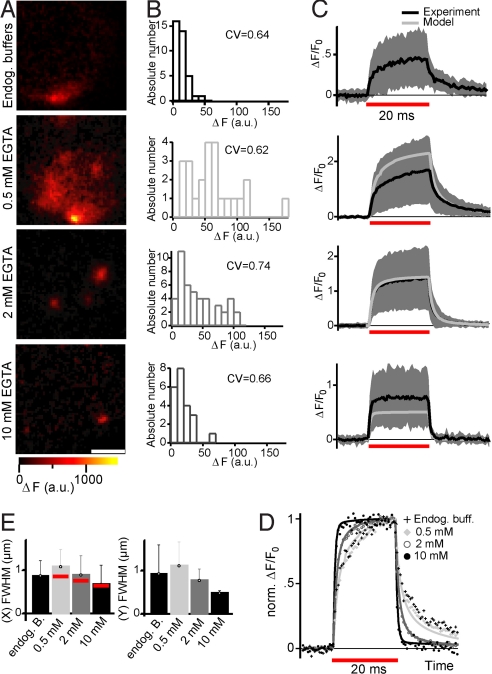
Sound coding at hair cell ribbon synapses is tightly regulated by Ca(2+). Here, we used patch-clamp, fast confocal Ca(2+) imaging and modeling to characterize synaptic Ca(2+) signaling in cochlear inner hair cells (IHCs) of hearing mice. Submicrometer fluorescence hotspots built up and collapsed at the base of IHCs within a few milliseconds of stimulus onset and cessation. They most likely represented Ca(2+) microdomains arising from synaptic Ca(2+) influx through Ca(V)1.3 channels. Synaptic Ca(2+) microdomains varied substantially in amplitude and voltage dependence even within single IHCs. Testing putative mechanisms for the heterogeneity of Ca(2+) signaling, we found the amplitude variability unchanged when blocking mitochondrial Ca(2+) uptake or Ca(2+)-induced Ca(2+) release, buffering cytosolic Ca(2+) by millimolar concentrations of EGTA, or elevating the Ca(2+) channel open probability by the dihydropyridine agonist BayK8644. However, we observed substantial variability also for the fluorescence of immunolabeled Ca(V)1.3 Ca(2+) channel clusters. Moreover, the Ca(2+) microdomain amplitude correlated positively with the size of the corresponding synaptic ribbon. Ribbon size, previously suggested to scale with the number of synaptic Ca(2+) channels, was approximated by using fluorescent peptide labeling. We propose that IHCs adjust the number and the gating of Ca(V)1.3 channels at their active zones to diversify their transmitter release rates.


Conflict of interest statement

The authors declare no conflict of interest.

Figures

Fig. 1.
Fig. 1.
Ca2+ microdomains mediated by Ca2+ influx at ribbon synapses in IHCs. Confocal images of Fluo-5N-filled IHCs were acquired in 3 repetitions of 6 images at ≈10 Hz: 2 images each before, during, and after stimulation by 200-ms depolarizations to −7 mV. Images averaged over runs and time frame (e.g., before stimulation) are shown. (A) Representative series of images under standard conditions showing 6 Fluo-5N fluorescence hotspots (Ca2+ microdomains) during the stimulus. The images were baseline subtracted (subtracting the average of the 2 images before depolarization; ΔF). On display are the image during stimulation and those preceding or following the stimulus. (B) Ca2+ microdomains (Center) evolved at ribbon synapses marked by rhodamine-conjugated CtBP2/RIBEYE-binding peptide (40 μM; Left, acquired before stimulation). Overlay (Right) depicts colocalization of Ca2+ microdomains and synaptic ribbons (both fluorescence channels acquired simultaneously). Note the extension of Ca2+ microdomains beyond ribbons. For 2-dye imaging, acquisition was repeated 6 instead of 3 times. (C) Ca2+ microdomains were abolished by omission of extracellular Ca2+ (Center, bath perfusion of nominally Ca2+-free solution and addition of 1 mM EGTA and 5 mM MgCl2) and reappeared after readdition of 5 mM [Ca2+]e to the IHC (imaging as in A). (Scale bars: 2 μm.)
Fig. 2.
Fig. 2.
Spatiotemporal properties and voltage dependence of Ca2+ microdomains. (A) Confocal image of a Ca2+ microdomain illustrating read-out sites for spot detection (white spots) and line scans (orthogonal dashed lines). (Scale bar: 2 μm.) (B) Representative spot detection experiment: the laser spot was first placed on the brightest pixel in the xy confocal image (A, center white spot). Top of the graph shows voltage protocol, middle shows Ca2+ current, and bottom shows ΔF at the center spot (black) and an outlying position (260 nm off center, gray). Ca2+ current (ICa) and ΔF represent averages obtained from 5 subsequent runs (interval: 2.25 s). Lines represent exponential fits to the ΔF rise and decay. (C) Isochronal analysis: the laser spot was subsequently displaced bilaterally from the center, and the fluorescence was recorded as described in B. ΔF traces were assembled in a pseudo-3D plot as a function of time and space. (D) Mean (black) and SD (gray) of 45 Ca2+ microdomains (in 17 IHCs) recorded as described in B; note the large amplitude variability. For each Ca2+ microdomain, only the maximum intensity recording was considered. (E) Mean and SD of ΔF (gray) as a function of depolarizing potential (Vm), obtained from spot-detection experiments at the center of the Ca2+ microdomain (n = 32 Ca2+ microdomains in 17 IHCs); ΔF was averaged over the last 15 ms of a 20-ms stimulus. ΔF (mean: gray) and ICa (mean: black) show a similar voltage dependence (thin lines: corresponding SDs). (F) Representative line scans (x and y, corresponding to the x and y scan lines in A). Red bar indicates time of depolarization to −7 mV. (Scale bar: 2 μm.)
Fig. 3.
Fig. 3.
Blocking CICR or mitochondrial Ca2+uptake. (A) Comparable mean (line) and SD (shaded area) of ΔF vs. membrane voltage (Vm) for cells loaded with either 100 μM ryanodine (12 microdomains in 9 IHCs) or vehicle (16 microdomains in 13 IHCs) via the patch pipette (KCl-based solution with 0.5 mM EGTA; see Methods). ΔF was obtained by spot detection as described in Fig. 2E. For each microdomain, the voltage protocol was repeated 3 times. Vm was offline-corrected for the voltage drop over residual series resistance, which was very relevant here because of the remaining potassium current. (B) Similar onset and decay kinetics with (gray, 15 microdomains in 10 IHCs) and without (black, 19 microdomains in 14 IHCs) ryanodine. Average (line) and SD (shaded area) of normalized ΔF traces (spot detection following depolarization to “nominally” −15.3 mV; only recordings with a voltage error <4 mV were considered). (C) Mean and SD of the FWHM of the Ca2+ microdomain along both perpendicular scan lines (fitting of a Gaussian function to the average of all lines acquired during depolarization). No difference was found between the 2 groups. X (control): 11 Ca2+ microdomains in 10 IHCs, Y (control): 7 Ca2+ microdomains in 7 IHCs, X (ryanodine): 11 Ca2+ microdomains in 8 IHCs, and Y (ryanodine): 8 Ca2+ microdomains in 6 IHCs). (D) Mean and SD of ΔF traces recorded by spot detection in response to 150-ms depolarizations to −7 mV (0.5 mM EGTA and 375 μM Fluo-4FF in the pipette; 10 mM [Ca2+]e and 5 μM BayK8644 in the bath) in control experiments (n = 11 Ca2+ microdomains in 7 IHCs), and in intracellular presence of FCCP (10 μM) and oligomycin (2.5 mg/mL), blocking mitochondrial Ca2+ uptake (n = 23 Ca2+ microdomains in 10 IHCs).
Fig. 4.
Fig. 4.
Effects of Ca2+ buffering on IHC Ca2+ microdomains. (A) Representative confocal ΔF images of IHCs (recorded as introduced in Fig. 1A) with close to native endogenous Ca2+ buffering (perforated-patch, top row, representing 37 Ca2+ microdomains in 14 IHCs) or various amounts of exogenously added EGTA: 0.5 mM (second row, representing 24 Ca2+ microdomains in 15 IHCs), 2 mM (third row, representing 45 Ca2+ microdomains in 17 IHCs), or 10 mM (bottom row, representing 22 Ca2+ microdomains in 7 IHCs). (Scale bar: 2 μm.) (B) Distributions of ΔFmax obtained for the buffering conditions in spot-detection experiments after box-car smoothing (2-ms box). (C) Experimental mean (black line) and SD (gray area) of ΔF/F0 traces as well as model prediction (gray line) for the respective buffering conditions. Model predictions were obtained only for exogenous buffering experiments (see Table S1 and SI Text) (D) Normalized mean ΔF/F0 traces of all 4 buffering conditions (markers) emphasizing the kinetic differences, and model predictions (lines) for exogenous buffering experiments. (E) Mean and SD of FWHM of the Ca2+ microdomain along both scan lines (fitting of a Gaussian function to the time-averaged line profile). Also shown are the model predictions (red bars).
Fig. 5.
Fig. 5.
Heterogeneous voltage dependence and Ca2+ channel number of synaptic Ca2+ channel clusters in IHCs. (A) To demonstrate the variable voltage dependence of ΔFmax, we display the average results (and SD) of fitting a Boltzmann function to the fractional voltage activation of ΔFF divided by the driving force (VVrev) of the underlying Ca2+ current]. Note that at −7 mV, the potential used for comparisons in Figs. 2 D and F, 3 B–D, 4, and 5 D and E, the activation of ΔF (mean: gray line, SD: light gray area) and ICa (mean: black line, SD: dark gray area) is nearly complete. Note the pronounced variability in the voltage dependence of activation, even within 1 cell (dashed traces: individual data curves from 3 Ca2+ microdomains in an IHC). (B) shows an xy scan through the basal portion of an IHC loaded with rhodamine-conjugated, CtBP2/RIBEYE-binding peptide (40 μM; dissolved in intracellular solution). Note the spots of increased fluorescence intensity, indicative of synaptic ribbons. (Scale bar: 2 μm.) (C) Representative confocal section of an IHC stained with a CaV1.3 antibody. (Scale bar: 2 μm.) (D) Correlation between Ca2+ microdomain ΔFmax and fluorescence intensity of the corresponding ribbon (amplitude of 2D Gaussian function, fit to the fluorescently tagged ribbon in xy scans acquired at rest and before spot detection). The microdomain ΔFmax was obtained at the maximum-intensity location, identified by a series of 11 axially (along optical axis) displaced measurements (200-nm steps). Note the positive correlation (Pr = 0.47, P < 0.01; n = 48 FCaFRIBEYE pairs in 18 IHCs). (E) Distributions of Ca2+ microdomain ΔFmax (amplitude of 1D Gaussian fit to time-averaged line-scan profile, n = 35), CaV1.3 immunofluorescence (n = 50), and 210-nm crimson bead fluorescence (n = 52).

References

    1. Fuchs PA, Glowatzki E, Moser T. The afferent synapse of cochlear hair cells. Curr Opin Neurobiol. 2003;13:452–458. - PubMed
    1. Moser T, Neef A, Khimich D. Mechanisms underlying the temporal precision of sound coding at the inner hair cell ribbon synapse. J Physiol. 2006;576:55–62. - PMC - PubMed
    1. Parsons TD, Lenzi D, Almers W, Roberts WM. Calcium-triggered exocytosis and endocytosis in an isolated presynaptic cell: Capacitance measurements in saccular hair cells. Neuron. 1994;13:875–883. - PubMed
    1. Moser T, Beutner D. Kinetics of exocytosis and endocytosis at the cochlear inner hair cell afferent synapse of the mouse. Proc Natl Acad Sci USA. 2000;97:883–888. - PMC - PubMed
    1. Brandt A, Khimich D, Moser T. Few CaV1.3 channels regulate the exocytosis of a synaptic vesicle at the hair cell ribbon synapse. J Neurosci. 2005;25:11577–11585. - PMC - PubMed

Publication types

Substances