. 2009 Mar 17;106(11):4531-6.
doi: 10.1073/pnas.0812661106. Epub 2009 Feb 25.

A retrograde signal from RyR1 alters DHP receptor inactivation and limits window Ca2+ release in muscle fibers of Y522S RyR1 knock-in mice

Affiliations

A retrograde signal from RyR1 alters DHP receptor inactivation and limits window Ca2+ release in muscle fibers of Y522S RyR1 knock-in mice

Zoita Andronache et al. Proc Natl Acad Sci U S A. .

Abstract

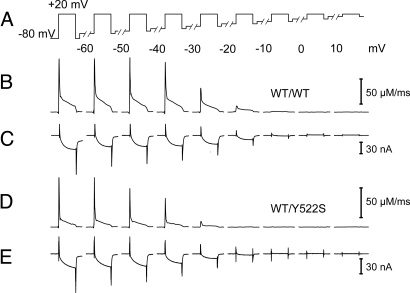
Malignant hyperthermia (MH) is a life-threatening hypermetabolic condition caused by dysfunctional Ca(2+) homeostasis in skeletal muscle, which primarily originates from genetic alterations in the Ca(2+) release channel (ryanodine receptor, RyR1) of the sarcoplasmic reticulum (SR). Owing to its physical interaction with the dihydropyridine receptor (DHPR), RyR1 is controlled by the electrical potential across the transverse tubular (TT) membrane. The DHPR exhibits both voltage-dependent activation and inactivation. Here we determined the impact of an MH mutation in RyR1 (Y522S) on these processes in adult muscle fibers isolated from heterozygous RyR1(Y522S)-knock-in mice. The voltage dependence of DHPR-triggered Ca(2+) release flux was left-shifted by approximately 8 mV. As a consequence, the voltage window for steady-state Ca(2+) release extended to more negative holding potentials in muscle fibers of the RyR1(Y522S)-mice. A rise in temperature from 20 degrees to 30 degrees C caused a further shift to more negative potentials of this window (by approximately 20 mV). The activation of the DHPR-mediated Ca(2+) current was minimally changed by the mutation. However, surprisingly, the voltage dependence of steady-state inactivation of DHPR-mediated calcium conductance and release were also shifted by approximately 10 mV to more negative potentials, indicating a retrograde action of the RyR1 mutation on DHPR inactivation that limits window Ca(2+) release. This effect serves as a compensatory response to the lowered voltage threshold for Ca(2+) release caused by the Y522S mutation and represents a novel mechanism to counteract excessive Ca(2+) leak and store depletion in MH-susceptible muscle.


Conflict of interest statement

The authors declare no conflict of interest.

Figures

Fig. 1.
Fig. 1.
Voltage-dependent activation of Ca2+ release flux and Ca2+ entry. Depolarizing voltage steps (100 milliseconds) with progressively increasing amplitude were applied from a holding potential of −80 mV (A). The time interval between pulses was 60 seconds. Fura-2 fluorescence ratios (B and E) were used to calculate Ca2+ release flux (C and F). Simultaneously recorded Ca2+ inward currents (D and G). Representative traces of a WT/WT (B–D) and a WT/Y522S fiber (E–G), respectively.
Fig. 2.
Fig. 2.
Voltage dependence of Ca2+ release flux and Ca2+ inward current. Voltage dependence of the peak (A) and plateau (B) components of Ca2+ release flux normalized to the maximal values. Plateau values were determined by averaging release flux values between 25 and 75 milliseconds during the pulse. (C) Voltage dependence of Ca2+ inward current density. (D) Normalized Ca2+ conductance derived from C. (E) Representative traces of intra-membrane charge movements obtained with 30 milliseconds pulses. (F) Normalized charge–voltage relationships determined by integrating the non-linear current at the onset of each pulse. Parameter values obtained by optimization in the removal fit analysis were as follows (for a detailed description and definitions, see (11)): WT/WT: koff,Dye = 35.6 ± 2.9 s−1, kon,S = 17.8 ± 1.6 μM−1 s−1, koff,S = 5.7 ± 0.7 s−1, kuptake = 5.4 × 10³ ± 0.7 × 10³ s−1. WT/Y522S: koff,Dye = 45.6 ± 4 s−1 (P = 0.05), kon,S = 21.3 ± 3.4 μM−1 s−1 (P = 0.37), koff,S = 9.5 ± 0.9 s−1 (P = 0.001), kuptake = 8.1 × 10³ ± 1.2 × 10³ s−1 (P = 0.06). The voltage dependence of release flux was fitted by the function F(V) = (a + bV)/(1 + exp((V1/2–V)/k)). The parameters V1/2, k, a and b had the following mean values: Peak (WT/WT): −11.5 ± 0.7 mV, 6.9 ± 0.2 mV, 0.0047 ± 0.0005 and 0.76 ± 0.02. Peak (WT/Y522S): −19.7 ± 0.7 mV (P = 3.6 × 10⁻¹¹), 7.7 ± 0.2 mV (P = 0.01), 0.0038 ± 0.0004 (P = 0.13) and 0.80 ± 0.016 (P = 0.08). Plateau (WT/WT): −15.2 ± 0.6 mV, 6.1 ± 0.1 mV, −0.0029 ± 0.0004 and 1.03 ± 0.007. Plateau (WT/Y522S): −23.6 ± 0.7 mV (P = 8.1 × 10⁻¹²), 6.4 ± 0.2 mV (P = 0.28), −0.0028 ± 0.0004 (P = 0.79) and 1.0 ± 0.006 (P = 0.02). Absolute values of peak release at + 50 mV were 150 ± 16.6 and 164 ± 17.6 μM/ms in WT/WT and WT/Y522S, respectively (P = 0.59), assuming 40% loading of the fibers (see Materials and Methods). The voltage dependence of the leak-corrected Ca2+ current density was fitted by the function I(V) = gCa,max(VVCa)/(1 + exp((V1/2–V)/k)). The parameters gCa,max, VCa, V1/2 and k had the following mean values: WT/WT: 174 ± 11.9 S F−1, 74.1 ± 2.4 mV, 5.7 ± 0.6 mV and 6.2 ± 0.3 mV, respectively. WT/Y522S: 183.1 ± 8.5 S F−1 (P = 0.56), 71.6 ± 2.3 mV (P = 0.47), 3.4 ± 1 mV (P = 0.04) and 6.2 ± 0.2 mV (P = 0.9), respectively. Mean linear capacitance was 6.5 ± 0.4 nF and 5.6 ± 0.3 nF (P = 0.1), respectively. Boltzmann fit parameters qmax, V1/2 and k of charge–voltage relationships were 28.5 ± 1.2 nC μF−1, −9.4 ± 1.2 mV and 12 ± 0.6 mV for WT/WT and 25.2 ± 0.9 nC μF−1(P = 0.036), −14.8 ± 1.3 mV (P = 0.015) and 11.4 ± 0.4 mV (P = 0.42) for WT/Y522S, respectively. Mean linear capacitance in these experiments was 3.7 ± 0.3 nF and 3.3 ± 0.1 nF (P = 0.27), respectively. P values in brackets indicate results of the t test. The number of experiments for Ca2+ release flux, Ca2+ current and charge movement were and 30, 29, and 9 for WT/WT and 23, 22 and 9 for WT/Y522S, respectively.
Fig. 3.
Fig. 3.
Voltage-activated SR Ca2+ permeability and SR Ca2+ content. (A) Ca2+ release flux (continuous trace) and depletion-corrected flux (SR permeability, dotted trace). (B) SR Ca2+ content at the beginning (initial) and at the end (final) of the depolarizing pulse for different test voltages. For large voltages (from 0 mV to + 50 mV in WT/WT and −10 mV to + 50 mV in WT/Y522S) the initial SR content was obtained by analyzing the corresponding Ca2+ release flux traces. For smaller pulses this parameter was set to the mean value of the estimates obtained between −10 and + 10 mV and at the leading test pulse at +20 mV. The mean initial SR content (total releasable Ca2+ referenced to myoplasmic water volume) estimated for + 50 mV is not significantly higher in WT/WT fibers (2.17 ± 0.2 mM, n = 30) compared to WT/Y522S fibers (1.98 ± 0.2 mM, n = 23, P = 0.53). Note that these concentration estimates assume 40% loading of fibers with EGTA from the current passing pipette (see Materials and Methods). (C and D) Voltage-dependence of peak (C) and plateau (D) permeabilities derived from the data in Fig. 2.
Fig. 4.
Fig. 4.
Voltage-dependent inactivation of Ca2+ release and Ca2+ inward current. (A) Progressively more depolarized conditioning potentials were applied to inactivate DHPR voltage sensors. Each conditioning depolarization lasted 30 seconds and was followed by a 100-millisecond test pulse to +20 mV. (B–E) Representative traces of simultaneously recorded Ca2+ release fluxes (B and D) and Ca2+ inward currents (C and E) in WT/WT (B and C) and WT/Y522S fibers (D and E).
Fig. 5.
Fig. 5.
Voltage dependence of inactivation of Ca2+ release and Ca2+ conductance. Fractional availability of peak Ca2+ release flux (A) and Ca2+ current (B) plotted as a function of conditioning voltage. In WT/Y522S fibers, both inactivation curves are shifted to more hyperpolarized potentials compared with WT/WT fibers. The voltage dependence of each relationship was fitted with a conventional Boltzmann function (continuous and dotted lines). The parameters V1/2 and k had the following values: Release: WT/WT; −34.4 ± 0.9 mV and 4.3 ± 0.3 mV (n = 17); WT/Y522S: −44.8 ± 0.8 mV (P = 6.7 × 10⁻¹⁰) and 5.4 ± 0.2 mV (P = 0.002) (n = 19). Current: WT/WT; −22.8 ± 1.2 mV and 6.6 ± 0.5 mV (n = 17); WT/Y522S: −32.1 ± 0.9 mV (P = 5 × 10⁻⁷) and 6.9 ± 0.2 mV (P = 0.55) (n = 18).
Fig. 6.
Fig. 6.
Alterations of window Ca2+ fluxes in WT/Y522S fibers. (A) Normalized voltage dependence of release activation (plateau permeability) and inactivation curves replotted from the data shown in Fig. 3D and Fig. 5A. (B) Normalized voltage dependence of Ca2+ channel conductance activation and inactivation curves replotted from the data shown in Fig. 2D and Fig. 5B. (C) Voltage dependence of window Ca2+ release (fraction of maximum) calculated from the product of the corresponding normalized activation and inactivation curves shown in (A) (continuous blue and red lines). (D) Voltage dependence of fractional window Ca2+ conductance calculated from the product of the corresponding activation and inactivation curves shown in (B). (E) Steady-state Ca2+ increase (expressed as fraction of dye bound to Ca2+) at the end of each conditioning voltage during the inactivation protocol (Fig. 4). (F) Voltage dependence of window L-type current derived from (D). The red dashed curves in (C), (D), and (F) were calculated under the assumption of no change in the voltage dependence of inactivation. (G and H) Effect of temperature on window Ca2+ elevation. The numbers of experiments were 17 (WT/WT) and 37 (WT/Y522S), respectively. (I) Model to summarize alterations in Ca2+ release control caused by the Y522S mutation in RyR1.

References

    1. MacLennan DH, Phillips MS. Malignant hyperthermia. Science. 1992;256:789–794. - PubMed
    1. Lehmann-Horn F, Jurkat-Rott K. Voltage-gated ion channels and hereditary disease. Physiol Rev. 1999;79:1317–1372. - PubMed
    1. Rosenberg H, Davis M, James D, Pollock N, Stowell K. Malignant hyperthermia. Orphanet J Rare Dis. 2007;2:21. - PMC - PubMed
    1. Robinson R, Carpenter D, Shaw MA, Halsall J, Hopkins P. Mutations in RYR1 in malignant hyperthermia and central core disease. Hum Mutat. 2006;27:977–989. - PubMed
    1. Melzer W, Herrmann-Frank A, Lüttgau HC. The role of Ca2+ ions in excitation-contraction coupling of skeletal muscle fibres. Biochim Biophys Acta. 1995;1241:59–116. - PubMed

Publication types

MeSH terms

Substances