. 2009 May 15;284(20):13812-13822.
doi: 10.1074/jbc.M808821200. Epub 2009 Feb 26.

Insight into the structural basis of pro- and antiapoptotic p53 modulation by ASPP proteins

Affiliations

Insight into the structural basis of pro- and antiapoptotic p53 modulation by ASPP proteins

Jinwoo Ahn et al. J Biol Chem. .

Abstract

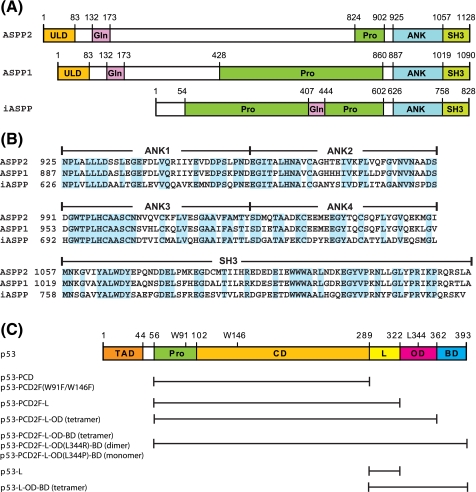
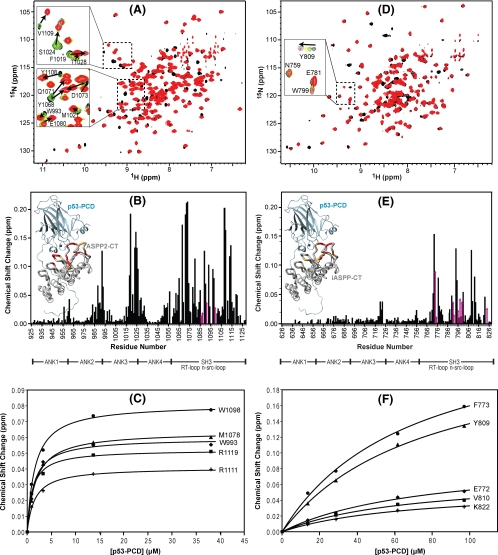
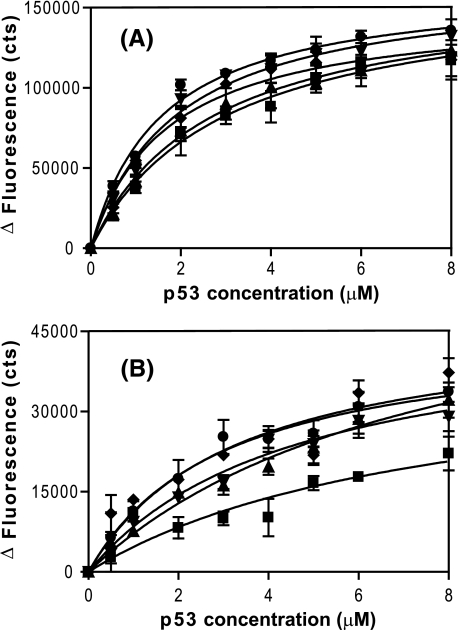
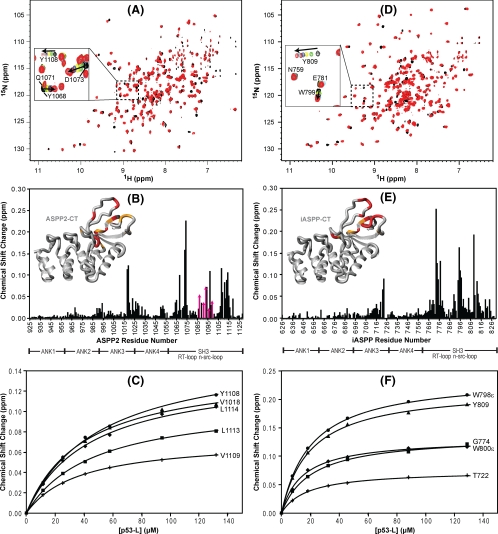
p53-dependent apoptosis is modulated by the ASPP family of proteins (apoptosis-stimulating proteins of p53; also called ankyrin repeat-, Src homology 3 domain-, and Pro-rich region-containing proteins). Its three known members, ASPP1, ASPP2, and iASPP, were previously found to interact with p53, influencing the apoptotic response of cells without affecting p53-induced cell cycle arrest. More specifically, the bona fide tumor suppressors, ASPP1 and ASPP2, bind to the core domain of p53 and stimulate transcription of apoptotic genes, whereas oncogenic iASPP also binds to the p53 core domain but inhibits p53-dependent apoptosis. Although the general interaction regions are known, details of the interfaces for each p53-ASPP complex have not been evaluated. We undertook a comprehensive biophysical characterization of ASPP-p53 complex formation and mapped the binding interfaces by NMR. We found that the interaction interface on p53 for the proapoptotic protein ASPP2 is distinct from that for the antiapoptotic iASPP. ASPP2 primarily binds to the core domain of p53, whereas iASPP predominantly interacts with a linker region adjacent to the core domain. Our detailed structural analyses of the ASPP-p53 interactions provide insight into the structural basis of the differential behavior of pro- and antiapoptotic ASPP family members.


Figures

FIGURE 1.
FIGURE 1.
Amino acid sequences and domain organization of ASPP and p53 proteins. A, domain organization of ASPP2, ASPP1, and iASPP. Individual domains are as follows: ubiquitin-like (ULD), glutamine-rich (Gln), proline-rich (Pro), ankyrin repeats (ANK), and Src homology 3 (SH3). B, sequence alignment of the C-terminal regions of ASPP2, ASPP1, and iASPP. Identical residues are highlighted in cyan. The domain boundaries are indicated at the top of the protein sequences. C, domain organization of p53. Individual domains are the transcription activation (TAD), the proline-rich (Pro), the DNA binding or core (CD), the linker (L), the oligomerization or tetramerization (OD), and the basic (BD) domains. All p53 protein constructs used in the present study are listed: p53-PCD (residues 56-289), p53-PCD2F (residues 56-289 with W91F and W146F), p53-PCD2F-L (residues 56-322 with W91F and W146F), p53-PCD2F-L-OD (residues 56-362 with W91F and W146F), p53-PCD2F-L-OD-BD (residues 56-393 with W91F and W146F), p53-PCD2F-L-OD(L344R)-BD (residues 56-393 with W91F, W146F, and L344R), p53-PCD2F-L-OD(L344P)-BD (residues 56-393 with W91F, W146F, and L344P), p53-L (residues 289-322), and p53-L-OD-BD (residues 289-393).
FIGURE 2.
FIGURE 2.
Chemical shift mapping of the interaction between p53-PCD and ASPP2-CT and iASPP-CT. Superposition of the 1H-15N TROSY-HSQC spectra of U-15N,2H-labeled ASPP2-CT (A) and 15N,2H-labeled iASPP-CT (D) without (black) and in the presence (red) of unlabeled p53-PCD. Two selected regions are expanded, and individual resonances along the titration are shown in the inset (increasing amounts of p53-PCD are shown with the colors blackgreenyellowcyanred). B and E, magnitude of the chemical shift changes versus residue number for ASPP2-CT and iASPP, respectively. The chemical shift change (Δδ) is calculated using the square root of ΔδHN2 + (ΔδN × 0.1)2, with ΔδHN and ΔδN representing the 1HN and 15N chemical shift differences, respectively, between free ASPP-CT (black spectrum in A and D) and the final mixture (red spectrum in A and D). Changes for residues whose resonances broaden and/or are difficult to follow through the entire titration are estimated from earlier titration points and indicated with magenta arrows. Structural mapping of the p53 binding site on ASPP2-CT and iASPP-CT is provided in the insets. Domain boundaries for ASPP2-CT and iASPP-CT are indicated below the residue numbers. The complex structures of ASPP2-CT·p53-PCD and iASPP-CT·p53-PCD were modeled based on the ASPP2-CT·p53-CD crystal structure (Protein Data Bank code 1YCS) by comparative modeling using MODELLER (46), and residues are colored according to the magnitude of their associated chemical shift changes: red, Δδ > (Δδaverage + 2 × S.D.); orange,(Δδaverage + 2 × S.D.) >Δδ > (Δδaverage + 1 × S.D.). C and F, titration curves for selected ASPP2-CT and iASPP-CT 1HN resonances, respectively.
FIGURE 3.
FIGURE 3.
Trp fluorescence binding curves for ASPP2-CT and iASPP-CT to various p53 constructs. Net changes of fluorescence at the emission maximum of either ASPP2-CT (A) or iASPP-CT (B) are plotted against the concentrations of different p53 constructs: p53-PCD2F-L (▪), p53-PCD2F-L-OD (▴), p53-PCD2F-L-OD-BD (▾), p53-PCD2F-L-OD(L344R)-BD (♦), and p53-PCD2F-L-OD(L344P)-BD (•). The data were fitted using a single-site binding site isotherm. The resulting dissociation constants for ASPP2-CT and p53-PCD2F-L, p53-PCD2F-L-OD, p53-PCD2F-L-OD-BD, p53-PCD2F-L-OD(L344R)-BD, and p53-PCD2F-L-OD(L344P)-BD are 3.0 ± 0.5, 2.7 ± 0.6, 1.9 ± 0.3, 1.7 ± 0.3, and 1.6 ± 0.2 μm, respectively. Equivalent dissociation constants for iASPP-CT are 7.7 ± 5.9, 7.6 ± 1.9, 4.6 ± 1.2, 3.3 ± 1.5, and 3.0 ± 0.6 μm, respectively. The errors in the iASPP-CT titration experiment are larger, since the net Trp fluorescence change was about 25% of the change for ASPP2-CT. All dissociation constants are summarized in Table 1.
FIGURE 4.
FIGURE 4.
Chemical shift mapping of the interaction between ASPP2-CT and iASPP-CT and the p53 linker peptide. A and D, superposition of the 1H-15N TROSY-HSQC spectra of U-15N,2H-labeled ASPP2-CT (A) and 15N,2H-labeled iASPP-CT (D) in the absence (black) and presence (red) of unlabeled p53-L. A selected region is expanded in each spectrum, and individual resonances along the titration are shown in the inset (increasing amounts of p53-L are shown with the colors blackgreenyellowblueburgundycyanred). B and E, magnitude of the chemical shift changes versus residue number for ASPP2-CT and iASPP, respectively. Domain boundaries for ASPP2-CT and iASPP-CT are indicated below the residue numbers. Structural mapping of the p53 binding site on ASPP2-CT and iASPP-CT is provided in the insets. The insets show the crystal structures of ASPP2-CT and iASPP-CT (Protein Data Bank codes 1YCS and 2VGE), where residues are colored according to the magnitude of their associated chemical shift changes: red, Δδ > (Δδaverage + 2 × S.D.); orange,(Δδaverage + 2 × S.D.) >Δδ > (Δδaverage + 1 × S.D.). C and F, titration curves for selected ASPP2-CT and iASPP-CT 1HN resonances, respectively.
FIGURE 5.
FIGURE 5.
Chemical shift mapping of the binding of different p53 constructs to ASPP2-CT and iASPP-CT. A-F, superposition of 1H-15N TROSY-HSQC spectra of U-15N,2H- or 15N,13C,2H-labeled ASPP2-CT and U-15N,2H- or 15N,13C,2H-labeled iASPP-CT in the absence (black) and presence (red) of unlabeled p53-PCD2F-L (A and D), p53-PCD2F (B and E), and p53-L (C and F). A-C, select resonances of ASPP2-CT are highlighted in dashed boxes and labeled with residue name and number. D-F, titrations of selected iASPP-CT resonances are displayed in the enlarged boxes, and the progression in the titration is shown by blackgreenyellowblueburgundycyanred contour colors.

References

    1. Lane, D. P., and Crawford, L. V. (1979) Nature 278 261-263 - PubMed
    1. Linzer, D. I., and Levine, A. J. (1979) Cell 17 43-52 - PubMed
    1. Linzer, D. I., Maltzman, W., and Levine, A. J. (1979) Virology 98 308-318 - PubMed
    1. Vousden, K. H. (2000) Cell 103 691-694 - PubMed
    1. Vousden, K. H., and Lu, X. (2002) Nat. Rev. Cancer 2 594-604 - PubMed

MeSH terms