. 2009 Jun;23(6):881-92.
doi: 10.1210/me.2008-0274. Epub 2009 Feb 26.

Increased insulin sensitivity in mice lacking collectrin, a downstream target of HNF-1alpha

Affiliations

Increased insulin sensitivity in mice lacking collectrin, a downstream target of HNF-1alpha

Sandra M Malakauskas et al. Mol Endocrinol. 2009 Jun.

Abstract

Collectrin is a downstream target of the transcription factor hepatocyte nuclear factor-1alpha (HNF-1alpha), which is mutated in maturity-onset diabetes of the young subtype 3 (MODY3). Evidence from transgenic mouse models with collectrin overexpression in pancreatic islets suggests divergent roles for collectrin in influencing beta-cell mass and insulin exocytosis. To clarify the function of collectrin in the pancreas, we used a mouse line with targeted deletion of the gene. We examined pancreas morphology, glucose homeostasis by ip glucose tolerance testing (IPGTT) and insulin tolerance testing (IPITT), and pancreas function by in vivo acute-phase insulin response determination and glucose-stimulated insulin secretion from isolated islets. We find no difference in either pancreas morphology or function between wild-type and collectrin-deficient animals (Tmem27(-/y)). However, we note that by 6 months of age, Tmem27(-/y) mice exhibit increased insulin sensitivity by IPITT and decreased adiposity by dual-energy x-ray absorptiometry scanning compared with wild-type. We have previously reported that Tmem27(-/y) mice exhibit profound aminoaciduria due to failed renal recovery. We now demonstrate that Tmem27(-/y) animals also display inappropriate excretion of some short-chain acylcarnitines derived from amino acid and fatty acid oxidation. We provide further evidence for compensatory up-regulation of oxidative metabolism in Tmem27(-/y) mice, along with enhanced protein turnover associated with preserved lean mass even out to 1.5 yr of age. Our studies suggest that collectrin-deficient mice activate a number of adaptive mechanisms to defend energy homeostasis in the setting of ongoing nutrient losses.


Figures
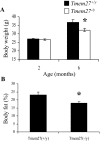
Figure 1
Figure 1
Tmem27−/y mice display lower body weight and percent body fat at 6 months of age. A, Body weights at 2 and 6 months of age on control diet. n ≥ 5. *, P = 0.02 vs. Tmem27+/y at 6 months. B, Body fat composition measured by DEXA scanning at 6 months of age. n = 14. *, P = 0.009 vs. Tmem27+/y. Data represent the mean ± sem.
Figure 2
Figure 2
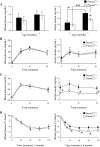
Tmem27−/y mice exhibit evidence of enhanced insulin sensitivity by in vivo assessments of glucose homeostasis at 6 months. A, Blood glucose and serum insulin values from animals fasted overnight. Blood glucose was measured using a glucometer, and serum insulin was quantified by ELISA. n ≥ 5. *, P = 0.05, Tmem27+/y vs. Tmem27−/y at 6 months; +, P = 0.02, Tmem27+/y at 2 vs. 6 months; **, P = 0.04, Tmem27−/y at 2 vs. 6 months. B, IPGTT at 2 months of age. Animals were fasted for 6 h and assessed for response to 1.5 g/kg glucose: left, blood glucose values; right, corresponding serum insulin levels. n ≥ 7. C, IPGTT repeated at 6 months of age: left, blood glucose values; right, corresponding serum insulin levels. n = 19. *, P ≤ 0.04 vs. Tmem27+/y at the corresponding time point. D, IPITT at 2 months of age (left, n = 9) or 6 months of age (right, n = 10). Animals were fasted for 6 h, and the blood glucose levels were monitored in response to 0.75 U/kg insulin. *, P ≤ 0.05 vs. Tmem27+/y at the corresponding time point. Data represent the mean ± sem.
Figure 3
Figure 3
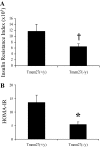
Calculated indices of insulin resistance at 6 months are lower in Tmem27−/y mice. A, The insulin resistance index was calculated from the areas under the blood glucose and serum insulin curves obtained during the 1.5 g/kg IPGTT at 6 months (IR = AUCglucose × AUCinsulin). n = 19. †, P = 0.06 vs. Tmem27+/y. B, HOMA-IR was determined from fasting blood glucose and serum insulin levels at 6 months [HOMA-IR = fasting glucose (millimoles per liter) × fasting insulin (microunits per milliliter)/22.5]. n = 9. *, P = 0.02 vs. Tmem27+/y. Data represent the mean ± sem. Both indices are reported in arbitrary units.
Figure 4
Figure 4
There are no gross morphological differences between the pancreata from Tmem27+/y and Tmem27−/y mice on NC and HFD. Hematoxylin staining of pancreatic sections at ×20 is shown. Islets are identified by insulin immunostaining in red. Top, NC: left, pancreas from Tmem27+/y animal; right, pancreas from Tmem27−/y animal. Bottom, HFD: left, pancreas from Tmem27+/y animal; right, pancreas from Tmem27−/y animal.
Figure 5
Figure 5
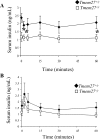
Tmem27−/y mice display a similar acute-phase insulin response to glucose and arginine stimulation as compared with Tmem27+/y mice at 6 months. A, Animals were fasted for 6 h, and serum insulin levels were monitored in response to an ip injection of 3 g/kg glucose. Although Tmem27−/y animals exhibit lower absolute serum insulin levels, the acute phase is suppressed in both groups. n = 8. *, P ≤ 0.05 vs. Tmem27+/y at corresponding time points. B, Animals were fasted for 6 h, and serum insulin levels were monitored in response to an ip injection of 0.3 g/kg arginine. Both groups exhibit a similar fold change in peak insulin response at 2 min compared with baseline. n = 6. Data represent the mean ± sem.
Figure 6
Figure 6
There is no difference in isolated islet function on NC and HFD at 6 months of age. A, Islets were isolated from Tmem27+/y and Tmem27−/y animals by Liberase R1 enzyme digestion, maintained in culture, and stimulated with 5.5 and 16.7 mm glucose. Secreted insulin was determined by RIA and normalized to total cellular protein content. Left, Control diet; right, HFD. B, Relative increase in insulin secretion with 16.7 mm glucose compared with 5.5 mm glucose on control diet and HFD. Data represent the mean ± sem. of two independent experiments, each of which was performed in triplicates of 20 islets per condition collected from four animals of each genotype.
Figure 7
Figure 7
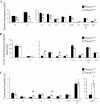
Tmem27−/y animals exhibit decreased plasma levels of a number of short-chain acylcarnitine species with corresponding urinary losses of a subset of those species. A, Plasma FC and acylcarnitine levels from animals fasted overnight were measured by mass spectrometry. n = 13–14. *, P < 0.0001 (FC, C2, C3), P = 0.0011 (C4), and P = 0.019 (C4-DC) vs. Tmem27+/y. B, The 24-h urine excretion of FC and acylcarnitines normalized to creatinine. Animals were housed individually with free access to food and water in metabolic cages for 24-h urine collection. FC, acylcarnitines, and creatinine were quantified by mass spectrometry. n = 11–12. *, P ≤ 0.05 vs. Tmem27+/y. C, Fractional excretions (FE) of FC and acylcarnitines were calculated using acylcarnitine and creatinine concentrations obtained from spot plasma and urine samples collected after an overnight fast. FE (percent) = ([AC]urine × [Cr]plasma)/([AC]plasma × [Cr]urine). C3 and C5:1: n = 5–8. *, P ≤ 0.05 vs. Tmem27+/y. C4-DC: n = 3–5. †, P = 0.07 vs. Tmem27+/y. Data represent the mean ± sem.
Figure 8
Figure 8
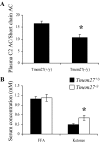
Tmem27−/y animals display evidence for increased oxidative metabolism by a decreased plasma C2-AC/short-chain acylcarnitine ratio and increased fasting serum ketone level. A, Plasma C2 acylcarnitine concentration was normalized to the total short-chain species concentration as determined from fasting plasma samples. n = 13–14. *, P = 0.0013 vs. Tmem27+/y. B, Serum nonesterified free fatty acids and ketones were measured enzymatically with an autoanalyzer after an overnight fast. n = 6–9. *, P = 0.039 vs. Tmem27+/y. Data represent the mean ± sem.
Figure 9
Figure 9
Tmem27−/y animals maintain normal fasting plasma amino acid levels in the setting of decreased muscle and increased liver amino acid content. A, Plasma amino acid concentration was measured by mass spectrometry after overnight fast. n = 5–6. *, P ≤ 0.05 vs. Tmem27+/y. B, Muscle amino acid content in the fed state as determined by mass spectrometry, normalized for total protein, and expressed relative to wild-type. n = 5–6. †, P = 0.06 (Leu/Ile), and P = 0.07 (Glu) vs. Tmem27+/y. C, Liver amino acid content in the fed state as determined by mass spectrometry, normalized for total protein, and expressed relative to wild-type. n = 5–6. *, P = 0.02 (Leu/Ile) vs. Tmem27+/y; †, P = 0.08 (Met), and P = 0.06 (Phe) vs. Tmem27+/y. Data represent the mean ± sem.
Figure 10
Figure 10
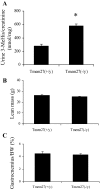
Tmem27−/y animals display enhanced proteolysis yet maintain their lean mass. A, The 24-h urinary 3-methylhistidine excretion normalized to creatinine. Animals were housed individually with free access to food and water in metabolic cages for 24-h urine collection. 3-Methylhistidine was determined by autoanalyzer. n = 6. *, P < 0.0001 vs. Tmem27+/y. B, Lean body mass in 1.5-yr-old mice, measured by DEXA scanning. n = 8. C, Gastrocnemius-to-body weight ratios assessed in 1.5-yr-old animals. n = 8. Data represent the mean ± sem.

Similar articles

Cited by

References

    1. Giuffrida FM, Reis AF 2005 Genetic and clinical characteristics of maturity-onset diabetes of the young. Diabetes Obes Metab 7:318–326 - PubMed
    1. Yamagata K, Oda N, Kaisaki PJ, Menzel S, Furuta H, Vaxillaire M, Southam L, Cox RD, Lathrop GM, Boriraj VV, Chen X, Cox NJ, Oda Y, Yano H, Le Beau MM, Yamada S, Nishigori H, Takeda J, Fajans SS, Hattersley AT, Iwasaki N, Hansen T, Pedersen O, Polonsky KS, Turner RC, Velho G, Chevre J-C, Froguel P, Bell GI 1996 Mutations in the hepatocyte nuclear factor-1α gene in maturity-onset diabetes of the young (MODY3). Nature 384:455–458 - PubMed
    1. Blumenfeld M, Maury M, Chouard T, Yaniv M, Condamine H 1991 Hepatic nuclear factor 1 (HNF1) shows a wider distribution than products of its known target genes in developing mouse. Development 113:589–599 - PubMed
    1. Pontoglio M, Sreenan S, Roe M, Pugh W, Ostrega D, Doyen A, Pick AJ, Baldwin A, Velho G, Froguel P, Levisetti M, Bonner-Weir S, Bell GI, Yaniv M, Polonsky KS 1998 Defective insulin secretion in hepatocyte nuclear factor 1α-deficient mice. J Clin Invest 101:2215–2222 - PMC - PubMed
    1. Lee YH, Sauer B, Gonzalez FJ 1998 Laron dwarfism and non-insulin-dependent diabetes mellitus in the Hnf-1α knockout mouse. Mol Cell Biol 18:3059–3068 - PMC - PubMed

Publication types

MeSH terms