

Direct renin inhibition improves systemic insulin resistance and skeletal muscle glucose transport in a transgenic rodent model of tissue renin overexpression
- PMID: 19246535
- PMCID: PMC2689809
- DOI: 10.1210/en.2008-1391
Direct renin inhibition improves systemic insulin resistance and skeletal muscle glucose transport in a transgenic rodent model of tissue renin overexpression
Abstract
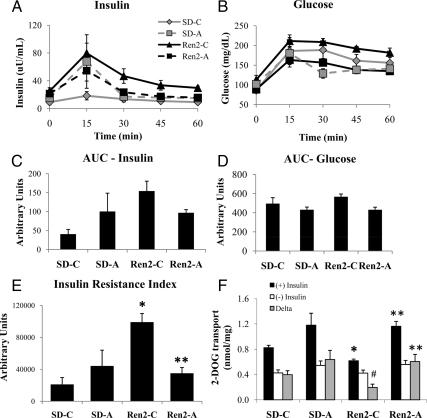
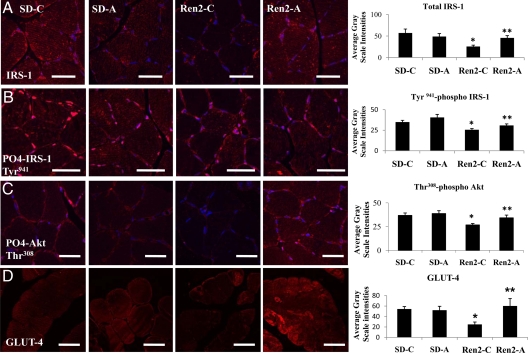
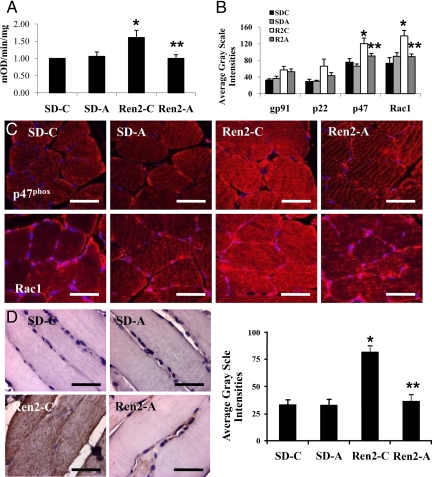
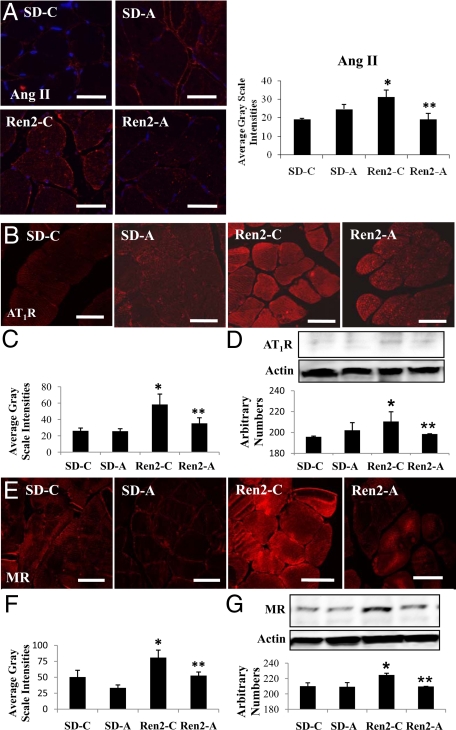
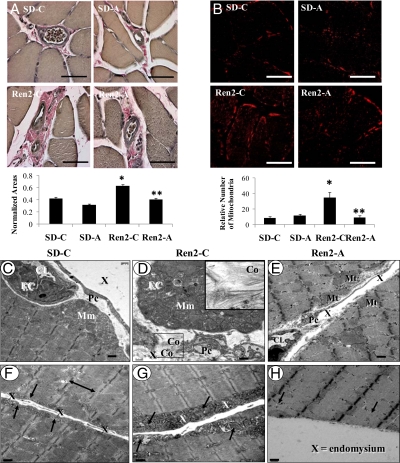
Renin is the rate-limiting enzyme in renin-angiotensin system (RAS) activation. We sought to determine the impact of renin inhibition on whole-body insulin sensitivity and skeletal muscle RAS, oxidative stress, insulin signaling, and glucose transport in the transgenic TG(mRen2)27 rat (Ren2), which manifests increased tissue RAS activity, elevated serum aldosterone, hypertension, and insulin resistance. Young (aged 6-9 wk) Ren2 and age-matched Sprague Dawley control rats were treated with aliskiren [50 mg/kg . d, ip] or placebo for 21 d and administered an ip glucose tolerance test. Insulin metabolic signaling and 2-deoxyglucose uptake in soleus muscle were examined in relation to tissue renin-angiotensin-aldosterone system [angiotensin (Ang) II, mineralocorticoid receptor (MR), and Ang type I receptor (AT(1)R)] and measures of oxidative stress as well as structural changes evaluated by light and transmission electron microscopy. Ren2 rats demonstrated systemic insulin resistance with decreased skeletal muscle insulin metabolic signaling and glucose uptake. This was associated with increased Ang II, MR, AT(1)R, oxidative stress, and reduced tyrosine insulin receptor substrate-1 phosphorylation, protein kinase B/(Akt) phosphorylation and glucose transporter-4 immunostaining. The Ren2 also demonstrated perivascular fibrosis and mitochondrial remodeling. Renin inhibition improved systemic insulin sensitivity, insulin metabolic signaling, and glucose transport along with normalization of Ang II, AT(1)R, and MR levels, oxidative stress markers, fibrosis, and mitochondrial structural abnormalities. Our data suggest that renin inhibition improves systemic insulin sensitivity, skeletal muscle insulin metabolic signaling, and glucose transport in Ren2 rats. This is associated with reductions in skeletal muscle tissue Ang II, AT(1)R, and MR expression; oxidative stress; fibrosis; and mitochondrial abnormalities.
Figures
Similar articles
-
Low-dose spironolactone reduces reactive oxygen species generation and improves insulin-stimulated glucose transport in skeletal muscle in the TG(mRen2)27 rat.Am J Physiol Endocrinol Metab. 2008 Jul;295(1):E110-6. doi: 10.1152/ajpendo.00258.2007. Epub 2008 Apr 29. Am J Physiol Endocrinol Metab. 2008. PMID: 18445755 Free PMC article.
-
Renin inhibition attenuates insulin resistance, oxidative stress, and pancreatic remodeling in the transgenic Ren2 rat.Endocrinology. 2008 Nov;149(11):5643-53. doi: 10.1210/en.2008-0070. Epub 2008 Jul 24. Endocrinology. 2008. PMID: 18653711 Free PMC article.
-
Nebivolol improves insulin sensitivity in the TGR(Ren2)27 rat.Metabolism. 2011 Dec;60(12):1757-66. doi: 10.1016/j.metabol.2011.04.009. Epub 2011 Jun 2. Metabolism. 2011. PMID: 21640361 Free PMC article.
-
The role of the renin-angiotensin system in the development of insulin resistance in skeletal muscle.Mol Cell Endocrinol. 2013 Sep 25;378(1-2):15-22. doi: 10.1016/j.mce.2012.04.011. Epub 2012 May 4. Mol Cell Endocrinol. 2013. PMID: 22564510 Review.
-
Improvement of insulin sensitivity by antagonism of the renin-angiotensin system.Am J Physiol Regul Integr Comp Physiol. 2007 Sep;293(3):R974-80. doi: 10.1152/ajpregu.00147.2007. Epub 2007 Jun 20. Am J Physiol Regul Integr Comp Physiol. 2007. PMID: 17581838 Review.
Cited by
-
Cardiac Development and Transcription Factors: Insulin Signalling, Insulin Resistance, and Intrauterine Nutritional Programming of Cardiovascular Disease.J Nutr Metab. 2018 Feb 1;2018:8547976. doi: 10.1155/2018/8547976. eCollection 2018. J Nutr Metab. 2018. PMID: 29484207 Free PMC article. Review.
-
Over-nutrition and metabolic cardiomyopathy.Metabolism. 2012 Sep;61(9):1205-10. doi: 10.1016/j.metabol.2012.02.013. Epub 2012 Mar 31. Metabolism. 2012. PMID: 22465089 Free PMC article. Review.
-
The renin-angiotensin-aldosterone system and glucose homeostasis.Trends Pharmacol Sci. 2011 Dec;32(12):734-9. doi: 10.1016/j.tips.2011.07.006. Epub 2011 Aug 29. Trends Pharmacol Sci. 2011. PMID: 21880378 Free PMC article. Review.
-
The Novel Angiotensin II Receptor Blocker Azilsartan Medoxomil Ameliorates Insulin Resistance Induced by Chronic Angiotensin II Treatment in Rat Skeletal Muscle.Cardiorenal Med. 2013 Jul;3(2):154-164. doi: 10.1159/000353155. Epub 2013 Jun 25. Cardiorenal Med. 2013. PMID: 23922555 Free PMC article.
-
Sex differences in the metabolic effects of the renin-angiotensin system.Biol Sex Differ. 2019 Jul 1;10(1):31. doi: 10.1186/s13293-019-0247-5. Biol Sex Differ. 2019. PMID: 31262355 Free PMC article. Review.
References
-
- Wei Y, Sowers JR, Nistala R, Gong H, Uptergrove GM, Clark SE, Morris EM, Szary N, Manrique C, Stump CS 2006 Angiotensin II-induced NADPH oxidase activation impairs insulin signaling in skeletal muscle cells. J Biol Chem 281:35137–35146 - PubMed
-
- Blendea MC, Jacobs D, Stump CS, McFarlane SI, Ogrin C, Bahtyiar G, Stas S, Kumar P, Sha Q, Ferrario CM, Sowers JR 2005 Abrogation of oxidative stress improves insulin sensitivity in the Ren-2 rat model of tissue angiotensin II overexpression. Am J Physiol Endocrinol Metab 288:E353–E359 - PubMed
-
- Hitomi H, Kiyomoto H, Nishiyama A, Hara T, Moriwaki K, Kaifu K, Ihara G, Fujita Y, Ugawa T, Kohno M 2007 Aldosterone suppresses insulin signaling via the downregulation of insulin receptor substrate-1 in vascular smooth muscle cells. Hypertension 50:750–755 - PubMed
-
- Furukawa N, Ongusaha P, Jahng WJ, Araki K, Choi CS, Kim HJ, Lee YH, Kaibuchi K, Kahn BB, Masuzaki H, Kim JK, Lee SW, Kim YB 2005 Role of Rho-kinase in regulation of insulin action and glucose homeostasis. Cell Metab 2:119–129 - PubMed
-
- Lastra G, Whaley-Connell A, Manrique C, Habibi J, Gutweiler AA, Appesh L, Hayden MR, Wei Y, Ferrario C, Sowers JR 2008 Low-dose spironolactone reduces reactive oxygen species generation and improves insulin-stimulated glucose transport in skeletal muscle in the TG(mRen2)27 rat. Am J Physiol Endocrinol Metab 295:E110–E116 - PMC - PubMed
Publication types
MeSH terms
Substances
Grants and funding
LinkOut - more resources
Full Text Sources
Other Literature Sources
Miscellaneous
