. 2009 Jun 11;113(24):6172-81.
doi: 10.1182/blood-2008-02-136762. Epub 2009 Feb 26.

Targeting the Notch1 and mTOR pathways in a mouse T-ALL model

Affiliations

Targeting the Notch1 and mTOR pathways in a mouse T-ALL model

Kathleen Cullion et al. Blood. .

Abstract

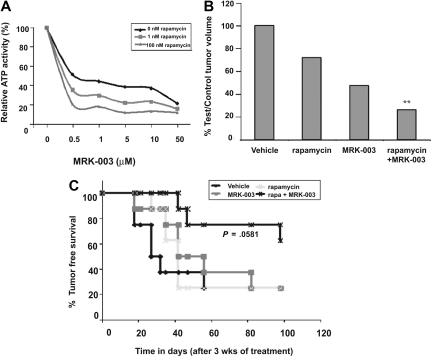
Mutations in NOTCH1 are frequently detected in patients with T-cell acute lymphoblastic leukemia (T-ALL) and in mouse T-ALL models. Treatment of mouse or human T-ALL cell lines in vitro with gamma-secretase inhibitors (GSIs) results in growth arrest and/or apoptosis. These studies suggest GSIs as potential therapeutic agents in the treatment of T-ALL. To determine whether GSIs have antileukemic activity in vivo, we treated near-end-stage Tal1/Ink4a/Arf+/- leukemic mice with vehicle or with a GSI developed by Merck (MRK-003). We found that GSI treatment significantly extended the survival of leukemic mice compared with vehicle-treated mice. Notch1 target gene expression was repressed and increased numbers of apoptotic cells were observed in the GSI-treated mice, demonstrating that Notch1 inhibition in vivo induces apoptosis. T-ALL cell lines also exhibit PI3K/mTOR pathway activation, indicating that rapamycin may also have therapeutic benefit. When GSIs are administered in combination with rapamycin, mTOR kinase activity is ablated and apoptosis induced. Moreover, GSI and rapamycin treatment inhibits human T-ALL growth and extends survival in a mouse xenograft model. This work supports the idea of targeting NOTCH1 in T-ALL and suggests that inhibition of the mTOR and NOTCH1 pathways may have added efficacy.


Figures

Figure 1
Figure 1
GSI treatment prolongs survival in a mouse T-ALL model. (A) Effective plasma compound levels in MRK-003–treated mice. Compound serum levels were analyzed 1 to 5 days after continuous dosing of MRK-003 treatment. Effective and stable compound levels (1-10 μM) were detected in the serum of treated mice after 12 hours at each drug concentration tested. (B) Plasma compound levels decrease during 4-day rest period. Mice were treated for 3 consecutive days with 150 mg/kg MRK-003. After the first treatment, serum was analyzed for compound levels every 24 hours for the duration of the dosing regimen. (C) Intermittent GSI dosing minimizes “on-target” gastrointestinal toxicity. To define a GSI dosing regimen with limited/no associated toxicity, mice were administered vehicle (V) or 150 mg/kg MRK-003 by oral gavage everyday (R1) or for 3 days followed by a 4-day rest period (R2). Mice were monitored daily for loss of body weight and for evidence of diarrhea. (D) Extended survival in MRK-003–treated leukemic mice. Near-end-stage diseased Tal1/Ink4a/Arf+/− mice were treated with 150 mg/kg MRK-003 (n = 16 mice) or 0.5% methylcellulose (n = 14 mice) orally for 3 days and rested for 4 days until mice were deemed moribund. Median survival for T-ALL mice treated with vehicle is 3 days, and 18 days for GSI treated mice (P < .005).
Figure 2
Figure 2
GSI treatment induces apoptosis of leukemic cells in vivo.(A) Leukemic mice were treated with a 150-mg/kg dose of MRK-003 or with vehicle for 3 days. Tumor sections were fixed in 10% buffered formalin and number of apoptotic cells was quantified using TUNEL assay (ApoTag Plus peroxidase from Chemicon, Temecula, CA). (B) Bar graph representing the fold change in TUNEL-positive cells compared with vehicle. Ten independent fields/section were counted to obtain the representative value.
Figure 3
Figure 3
GSI-treated tumors do not appear to develop GSI resistance. Thymomas from MRK-003– or vehicle-treated mice were harvested from the animals and converted to in vitro culture. (A) Leukemic cell lines from vehicle- and GSI-treated mice express high levels of intracellular Notch1 and remain GSI responsive. Leukemic cell lines were treated for 48 hours with 1 μM MRK-003 or DMSO carrier. Cell lysates were examined for intracellular Notch1 levels by immunoblotting with an anti-Notch1IC Val1744 (no. 2421; Cell Signaling Technology) and anti–β-actin antibodies. (B) Leukemic growth remains Notch1 dependent. Leukemic cell lines, generated from vehicle- and GSI-treated mice, were treated with vehicle or 1 μM MRK-003 for 3 and 6 days. Cells were then assayed for DNA content by staining with propidium iodide followed by flow cytometry. The figure is a representative experiment using cell line 6838.
Figure 4
Figure 4
Notch1 target gene expression is repressed in GSI-treated leukemic Tal1/Ink4a/Arf+/− mice. At killing, thymomas were harvested from vehicle- and MRK-003–treated mice and c-Myc (A), Pre-Tα (B), Deltex1 (C), and Hes1 (D) expression was quantified using real-time PCR. The copy number for each target gene was normalized to the copy number for β-actin using the ΔΔCT method. The following result is an average of 3 independent experiments. The mouse T-ALL cell line 720 was treated in vitro with 1 μM MRK-003 or DMSO for 72 hours and used as a positive control in these experiments.
Figure 5
Figure 5
The mTOR pathway is activated in all mouse T-ALL cell lines examined. (A) Primary mouse T-ALL tumors exhibit activation of Akt and mTOR pathways. Thymomas from vehicle-treated mice were harvested at killing and tumor sections were fixed in 10% buffered formalin. Sections were then stained with antibodies to phospho-S6 ribosomal protein (p-S6RP) or phospho-Akt (Ser473). Scale bars represent 50 μM. (B) Reduced levels of mTOR substrates are observed when mouse T-ALL lines are treated with GSI. Primary murine leukemic lines were treated with 1 μM MRK-003 or DMSO for 48 hours. MTOR activity was assayed by immunoblotting cell lysates with anti–phospho-p70 S6 kinase or phospho-S6 ribosomal antibodies (no. 9205, no. 2215; Cell Signaling Technology). p70 S6 kinase and S6 ribosomal were used as loading controls (no. 9202, no. 2217; Cell Signaling Technology). (C) Notch1 regulates Akt activity in some mouse T-ALL lines. Primary murine leukemic lines were treated with 1 μM MRK-003 or DMSO for 48 hours. Akt activity was assayed by immunoblotting cell lysates with anti–phospho-Akt Ser 473 antibody (no. 9271; Cell Signaling Technology). Akt was used as a loading control (no. 9272; Cell Signaling Technology). Fold reductions in kinase activity were determined by densitometry and represent ratios (phospho/total) normalized to DMSO-treated samples.
Figure 6
Figure 6
GSI and rapamycin treatment in vitro induces massive apoptosis of mouse T-ALL cells and cooperates to suppress mTOR activity. (A) Mouse T-ALL cell lines, 135, 5046, and 5151, were treated with DMSO, 1 μM MRK-003, 10 nM rapamycin, or 1 μM MRK-003 and 10 nM rapamycin for 24 hours. Cells were assayed for DNA content by staining with PI followed by flow cytometry. (B) mTOR activity is ablated when mouse T-ALL lines are treated with GSI and rapamycin. Mouse T-ALL lines, 720 and 5046, were treated with DMSO, 1 μM MRK-003, 10 nM rapamycin, or 1 μM MRK-003 and 10 nM rapamycin, and mTOR kinase activity was assayed by immunoblotting the cell lysates with phospho-p70 S6 kinase antibody (no. 9205; Cell Signaling Technology) after 18 hours. Total p70 S6 kinase was used as a loading control (no. 9202; Cell Signaling Technology). Fold reductions in kinase activity were determined by densitometry and represent ratios (phospho/total) normalized to DMSO-treated samples. (C) At low pharmacologic doses, MRK-003 and rapamycin may have synergistic effects on mouse leukemic growth. Mouse T-ALL lines, 720 and 5046, were treated for 72 hours with 1 nM rapamycin, increasing concentrations of MRK-003 (10−5 to 101 μM), or rapamycin and MRK-003, and growth was assayed by MTT analysis. The figure is a representative of 3 independent experiments using mouse T-ALL cell line 720.
Figure 7
Figure 7
GSI and rapamycin treatment inhibits human T-ALL growth and extends survival. (A) GSI and rapamycin treatment inhibits human T-ALL growth in vitro. The human T-ALL cell line (TALL-1) was treated with 0, 0.5, 1, 5, 10, or 50 μM MRK-003 in addition to 0, 1, or 100 nM rapamycin and ATP activity quantified using the Vialight assay kit. (B) The combination treatment (GSI and rapamycin) inhibits human T-ALL growth in vivo more effectively than treatment with either single agent. CD1 nu/nu mice were injected with human T-ALL cell line, TALL-1. When tumors reached 250 mm3, xenograft mice were treated with vehicle, rapamycin, MRK-003, or a combination of MRK-003 and rapamycin for 3 weeks. MRK-003 was dosed at either 0 or 150 mg/kg by mouth once a week. Rapamycin was dosed at either 0 or 20 mg/kg by mouth daily. After treatment, tumors were callipered and body weight was recorded. Bar graph indicates relative tumor volumes at killing. The following statistics were analyzed by a t test; vehicle versus rapamycin (P = .001), vehicle versus MRK-003 (P = .325), rapamycin versus rapamycin + MRK-003 (P = .002), MRK-003 versus rapamycin + MRK-003 (P = .001). (C) GSI and rapamycin treatment inhibits human leukemic growth in vivo and increases overall survival. After 3 weeks of treatment with vehicle, MRK-003 (150 mg/kg per week), rapamycin (20 mg/kg daily), or MRK-003 and rapamycin, T-ALL-1 xenograft mice were monitored for tumor recurrence. Tumor-free survival was compiled on a Kaplan-Meier survival plot. Data were analyzed by a log rank test (P = .058).

Comment in

  • Notch targeting 2.0.
    Aster JC. Aster JC. Blood. 2009 Jun 11;113(24):6044-5. doi: 10.1182/blood-2009-03-212829. Blood. 2009. PMID: 19520812 No abstract available.

References

    1. Aplan PD, Lombardi DP, Kirsch IR. Structural characterization of SIL, a gene frequently disrupted in T-cell acute lymphoblastic leukemia. Mol Cell Biol. 1991;11:5462–5469. - PMC - PubMed
    1. Aplan PD, Lombardi DP, Reaman GH, Sather HN, Hammond GD, Kirsch IR. Involvement of the putative hematopoietic transcription factor SCL in T-cell acute lymphoblastic leukemia. Blood. 1992;79:1327–1333. - PubMed
    1. Bash RO, Hall S, Timmons CF, et al. Does activation of the TAL1 gene occur in a majority of patients with T-cell acute lymphoblastic leukemia? a pediatric oncology group study. Blood. 1995;86:666–676. - PubMed
    1. Bernard O, Lecointe N, Jonveaux P, et al. Two site-specific deletions and t(1;14) translocation restricted to human T-cell acute leukemias disrupt the 5′ part of the tal-1 gene. Oncogene. 1991;6:1477–1488. - PubMed
    1. Boehm T, Foroni L, Kaneko Y, Perutz MF, Rabbitts TH. The rhombotin family of cysteine-rich LIM-domain oncogenes: distinct members are involved in T-cell translocations to human chromosomes 11p15 and 11p13. Proc Natl Acad Sci U S A. 1991;88:4367–4371. - PMC - PubMed

Publication types

MeSH terms