

Anti-inflammatory and renal protective actions of stanniocalcin-1 in a model of anti-glomerular basement membrane glomerulonephritis
- PMID: 19246645
- PMCID: PMC2671368
- DOI: 10.2353/ajpath.2009.080476
Anti-inflammatory and renal protective actions of stanniocalcin-1 in a model of anti-glomerular basement membrane glomerulonephritis
Abstract
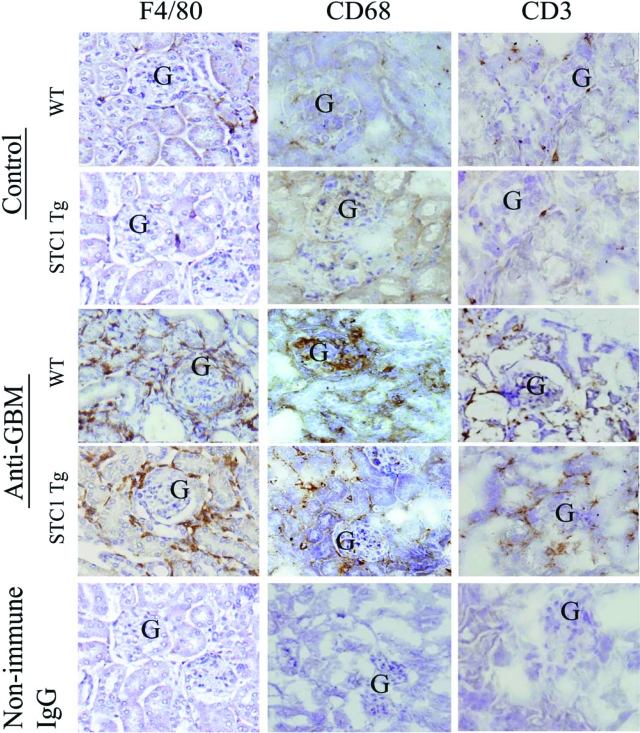
We have previously shown that stanniocalcin-1 (STC1) inhibits the transendothelial migration of macrophages and T cells, suppresses superoxide generation in macrophages, and attenuates macrophage responses to chemoattractants. To study the effects of STC1 on inflammation, in this study we induced a macrophage- and T-cell-mediated model of anti-glomerular basement membrane disease in STC1 transgenic mice, which display elevated serum STC1 levels and preferentially express STC1 in both endothelial cells and macrophages. We examined the following parameters both at baseline and after anti-glomerular basement membrane antibody treatment: blood pressure; C(3a) levels; urine output; proteinuria; blood urea nitrogen; and kidney C(3) deposition, fibrosis, histological changes, cytokine expression, and number of T cells and macrophages. Compared with wild-type mice, after anti-glomerular basement membrane treatment STC1 transgenic mice exhibited: i) diminished infiltration of inflammatory macrophages in the glomeruli; ii) marked reduction in crescent formation and sclerotic glomeruli; iii) decreased interstitial fibrosis; iv) preservation of kidney function and lower blood pressure; v) diminished C(3) deposition in the glomeruli; and vi) reduced expression of macrophage inhibitory protein-2 and transforming growth factor-beta2 in the kidney. Compared with baseline, wild-type mice, but not STC1 transgenic mice, had higher proteinuria and a marked reduction in urine output. STC1 had minimal effects, however, on both T-cell number in the glomeruli and interstitium and on cytokine expression characteristic of either TH1 or TH2 activation. These data suggest that STC1 is a potent anti-inflammatory and renal protective protein.
Figures


Similar articles
-
Mammalian stanniocalcin-1 activates mitochondrial antioxidant pathways: new paradigms for regulation of macrophages and endothelium.Am J Physiol Renal Physiol. 2010 Feb;298(2):F248-54. doi: 10.1152/ajprenal.00260.2009. Epub 2009 Aug 5. Am J Physiol Renal Physiol. 2010. PMID: 19656913 Free PMC article. Review.
-
Severe Nephrotoxic Nephritis following Conditional and Kidney-Specific Knockdown of Stanniocalcin-1.PLoS One. 2015 Sep 22;10(9):e0138440. doi: 10.1371/journal.pone.0138440. eCollection 2015. PLoS One. 2015. PMID: 26393521 Free PMC article.
-
Matrix metalloproteinase-12 deficiency attenuates experimental crescentic anti-glomerular basement membrane glomerulonephritis.Nephrology (Carlton). 2018 Feb;23(2):183-189. doi: 10.1111/nep.12964. Nephrology (Carlton). 2018. PMID: 27862656
-
Macrophage A2A Adenosine Receptors Are Essential to Protect from Progressive Kidney Injury.Am J Pathol. 2016 Oct;186(10):2601-13. doi: 10.1016/j.ajpath.2016.06.017. Epub 2016 Aug 9. Am J Pathol. 2016. PMID: 27520357 Free PMC article.
-
Anti-Glomerular Basement Membrane Disease: Recent Updates.Adv Kidney Dis Health. 2024 May;31(3):206-215. doi: 10.1053/j.akdh.2024.04.007. Adv Kidney Dis Health. 2024. PMID: 39004460 Review.
Cited by
-
Stanniocalcin-1 controls ion regulation functions of ion-transporting epithelium other than calcium balance.Int J Biol Sci. 2015 Jan 1;11(2):122-32. doi: 10.7150/ijbs.10773. eCollection 2015. Int J Biol Sci. 2015. PMID: 25561895 Free PMC article.
-
Susceptibility quantitative trait loci for pathogenic leucocytosis in SCG/Kj mice, a spontaneously occurring crescentic glomerulonephritis and vasculitis model.Clin Exp Immunol. 2014 Jul;177(1):353-65. doi: 10.1111/cei.12333. Clin Exp Immunol. 2014. PMID: 24654803 Free PMC article.
-
Stanniocalcin-1 is a Modifier of Oxygen-Induced Retinopathy Severity.Curr Eye Res. 2020 Jan;45(1):46-51. doi: 10.1080/02713683.2019.1645184. Epub 2019 Aug 28. Curr Eye Res. 2020. PMID: 31314602 Free PMC article.
-
Properties and usefulness of aggregates of synovial mesenchymal stem cells as a source for cartilage regeneration.Arthritis Res Ther. 2012 Jun 7;14(3):R136. doi: 10.1186/ar3869. Arthritis Res Ther. 2012. PMID: 22676383 Free PMC article.
-
Effects of stanniocalcin-1 overexpressing hepatocellular carcinoma cells on macrophage migration.PLoS One. 2020 Nov 6;15(11):e0241932. doi: 10.1371/journal.pone.0241932. eCollection 2020. PLoS One. 2020. PMID: 33156861 Free PMC article.
References
-
- Fontaine M. Corpuscles de Stannius et regulation ionique (Ca K, Na) du milieu interieur de l’Anguille (Anguilla anguilla L.). C R Acad Sc Paris Serie D. 1964;259:875–878. - PubMed
-
- Stannius H. Uber nebenniere bei knochenfischen. Arch Anat Physiol. 1939;6:97–101.
-
- Wendelaar Bonga SE, Pang PK. Control of calcium regulating hormones in the vertebrates: parathyroid hormone, calcitonin, prolactin, and stanniocalcin. Int Rev Cytol. 1991;128:139–213. - PubMed
-
- Lafeber FP, Flik G, Wendelaar Bonga SE, Perry SF. Hypocalcin from Stannius corpuscles inhibits gill calcium uptake in trout. Am J Physiol. 1988;254:R891–R896. - PubMed
-
- Chang AC, Janosi J, Hulsbeek M, de Jong D, Jeffrey KJ, Noble JR, Reddel RR. A novel human cDNA highly homologous to the fish hormone stanniocalcin. Mol Cell Endocrinol. 1995;112:241–247. - PubMed
Publication types
MeSH terms
Substances
Grants and funding
LinkOut - more resources
Full Text Sources
Other Literature Sources
Molecular Biology Databases
Miscellaneous
