. 2009 Jun;16(6):847-57.
doi: 10.1038/cdd.2009.14. Epub 2009 Feb 27.

Preventing oxidative stress: a new role for XBP1

Affiliations

Preventing oxidative stress: a new role for XBP1

Y Liu et al. Cell Death Differ. 2009 Jun.

Abstract

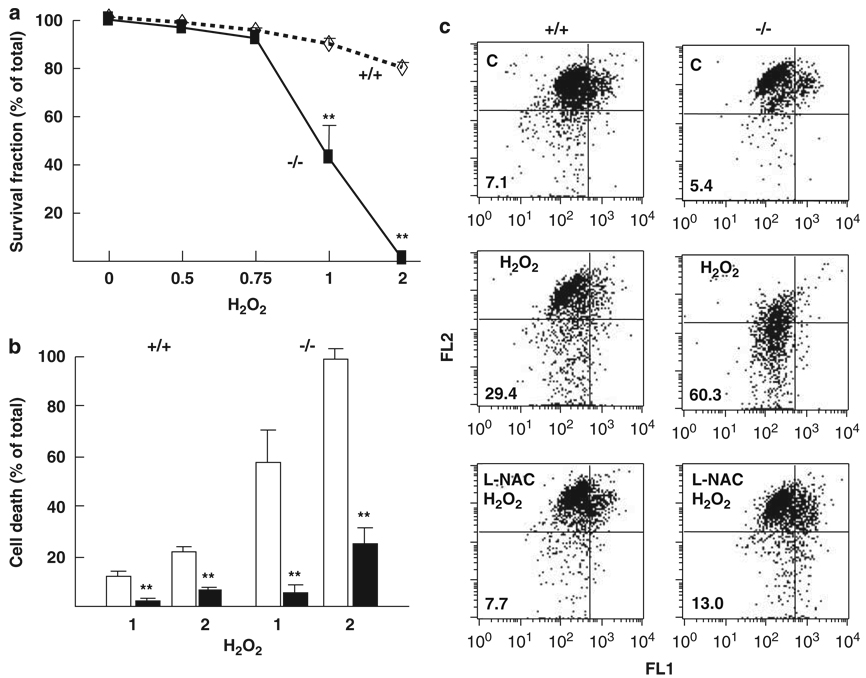
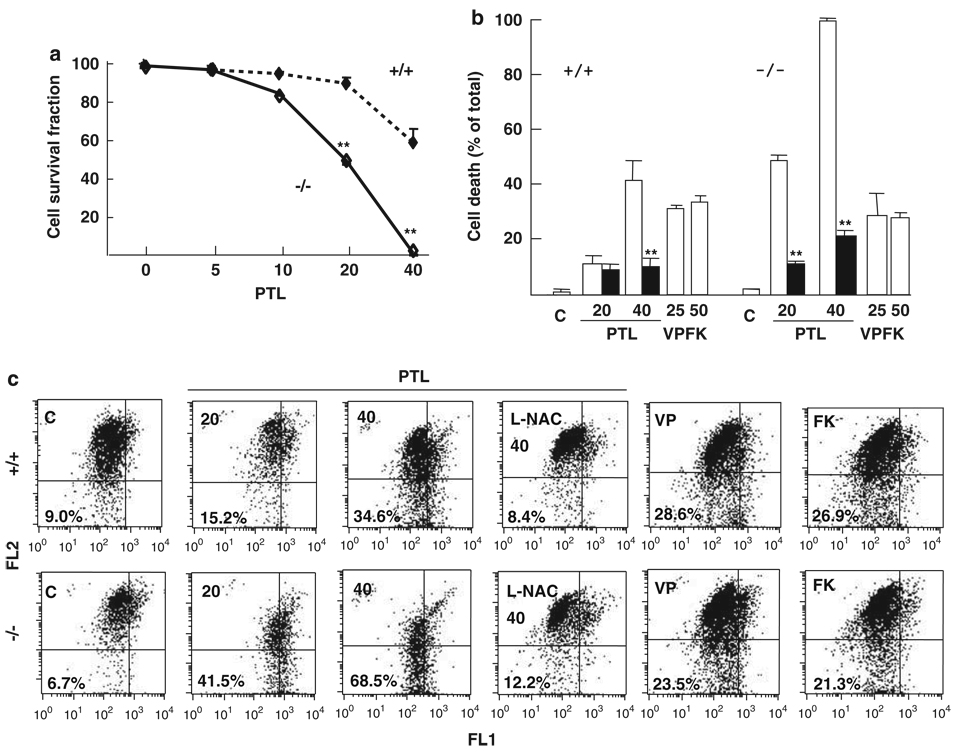
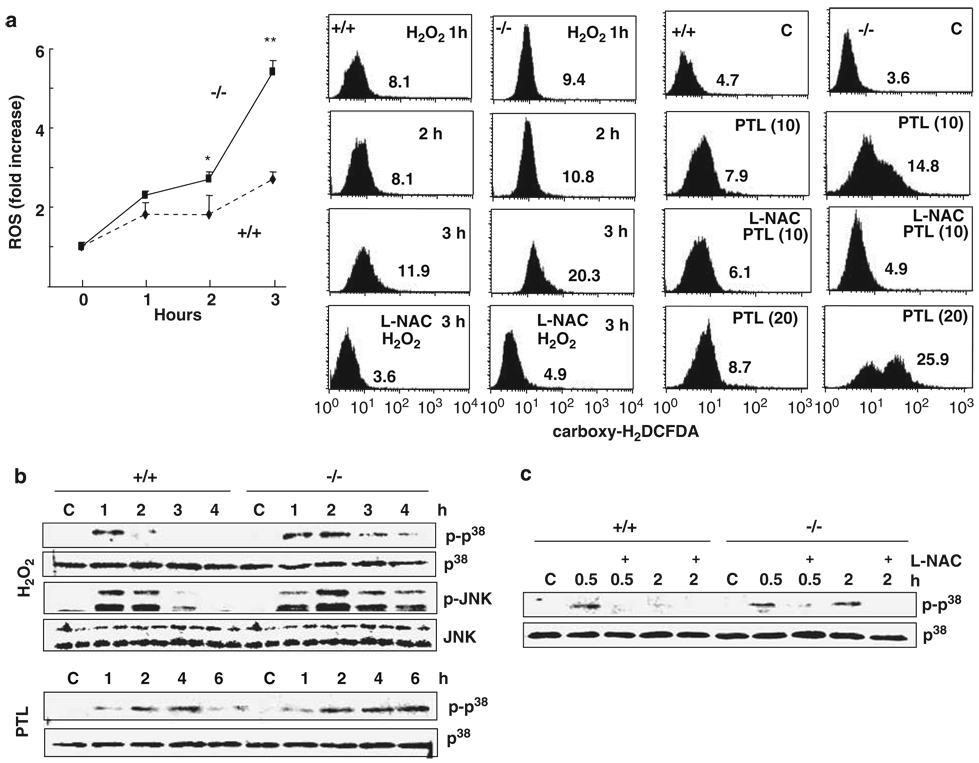
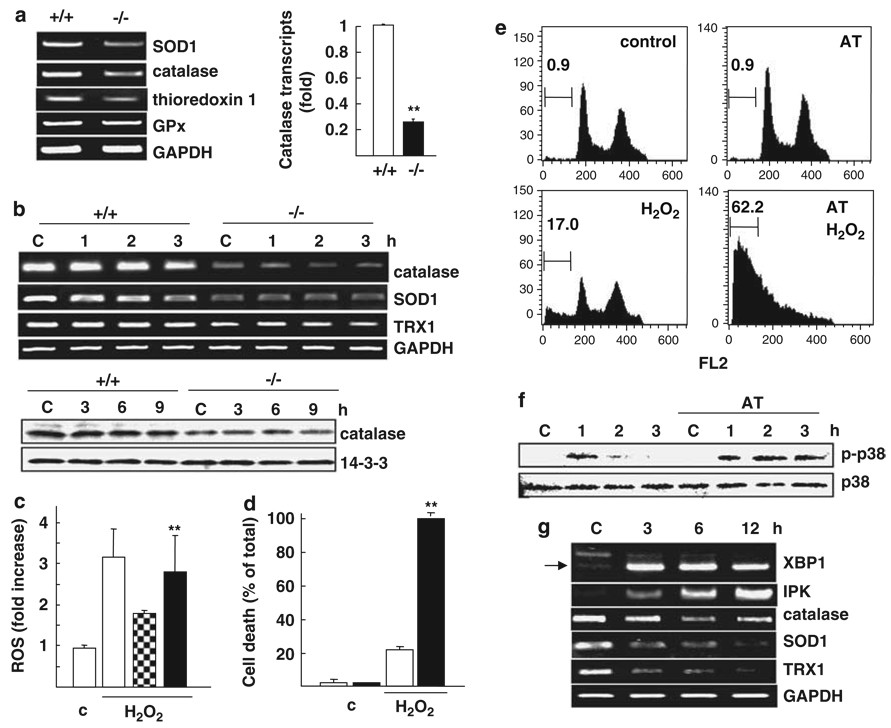
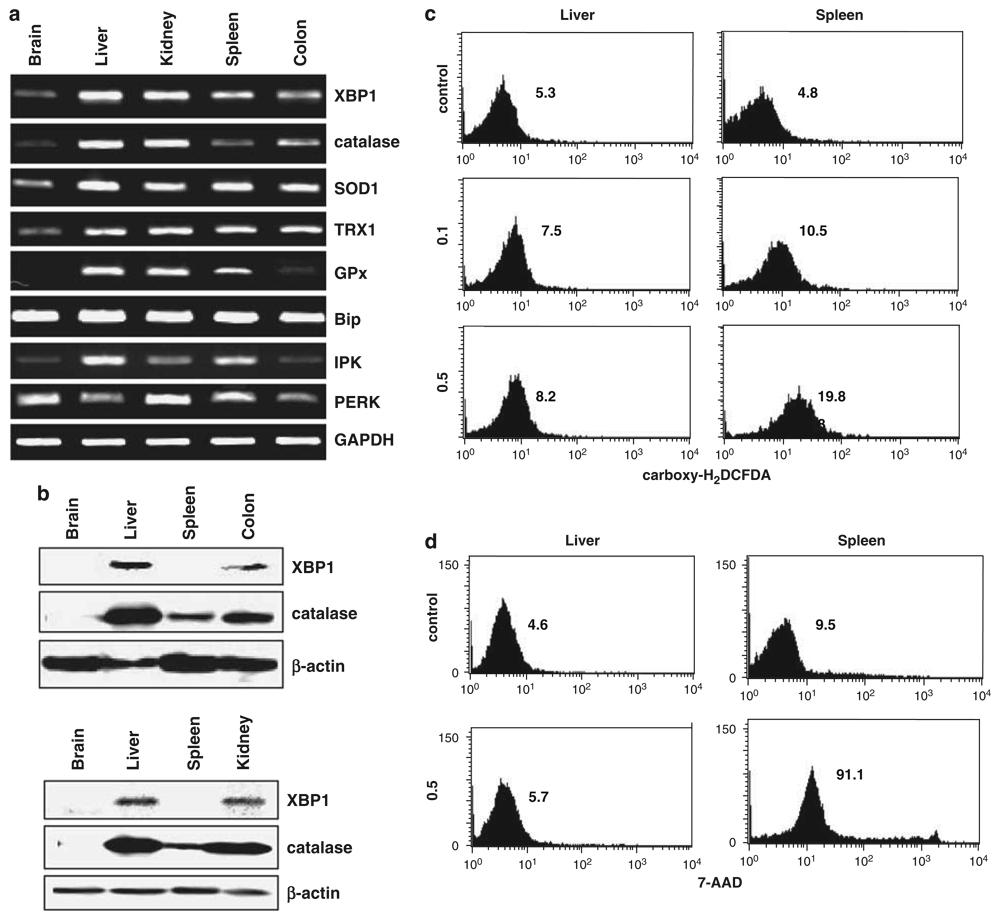
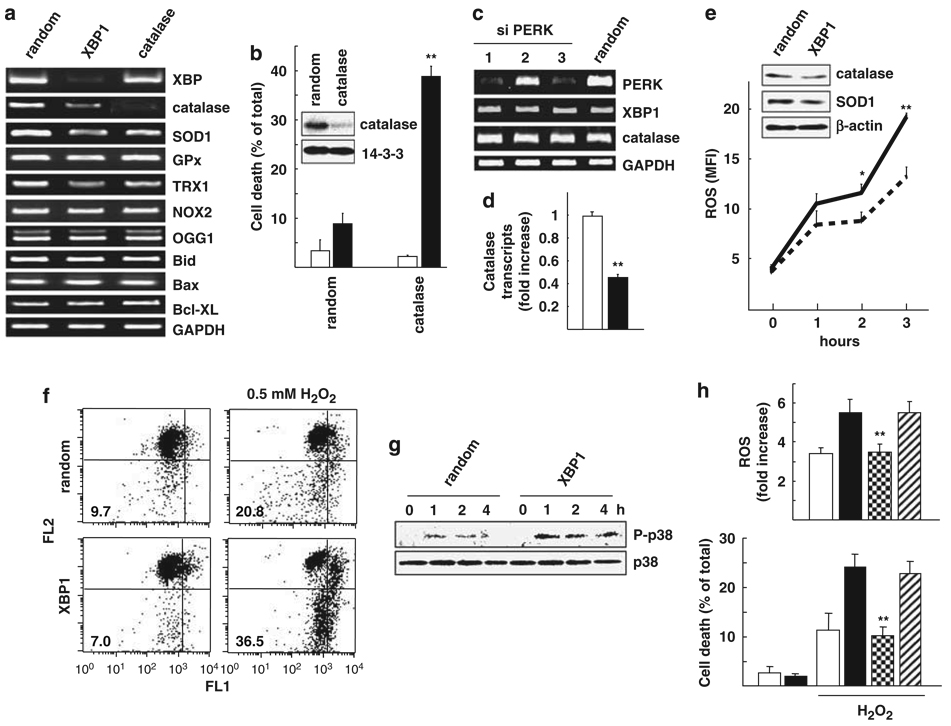
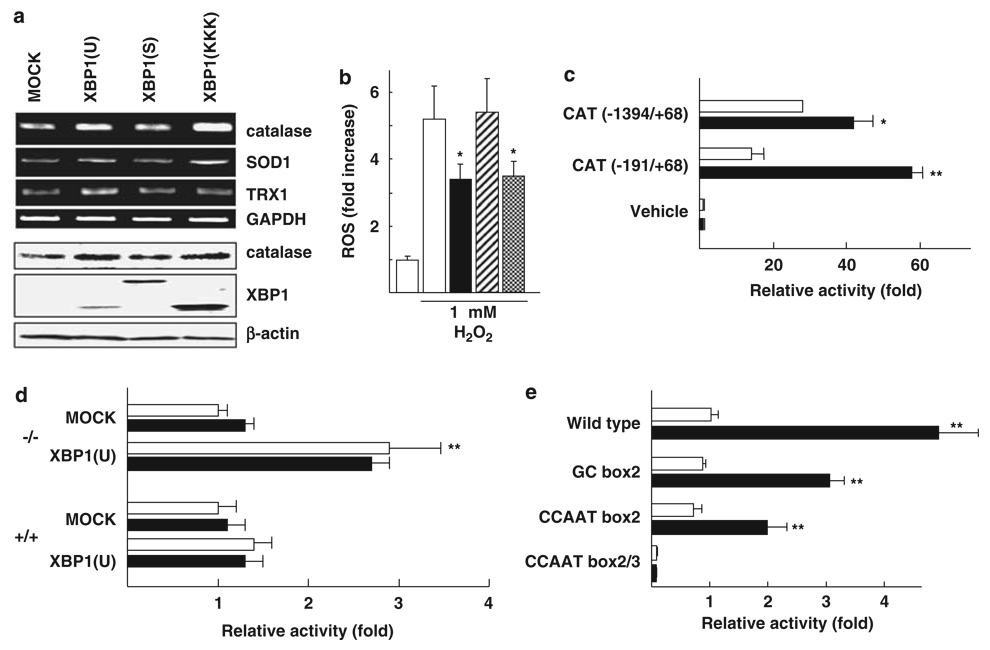
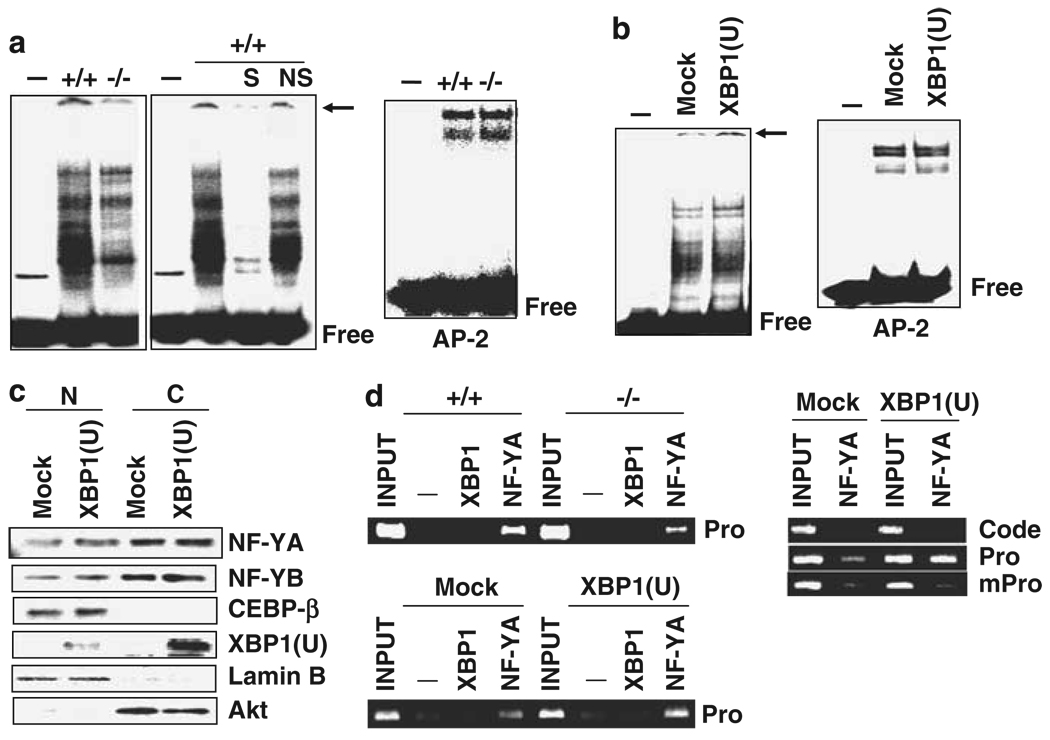
Antioxidant molecules reduce oxidative stress and protect cells from reactive oxygen species (ROS)-mediated cellular damage and probably the development of cancer. We have investigated the contribution of X-box-binding protein (XBP1), a major endoplasmic reticulum stress-linked transcriptional factor, to cellular resistance to oxidative stress. After exposure to hydrogen peroxide (H(2)O(2)) or a strong ROS inducer parthenolide, loss of mitochondrial membrane potential (MMP) and subsequent cell death occurred more extensively in XBP1-deficient cells than wild-type mouse embryonic fibroblast cells, whereas two other anticancer agents induced death similarly in both cells. In XBP1-deficient cells, H(2)O(2) exposure induced more extensive ROS generation and prolonged p38 phosphorylation, and expression of several antioxidant molecules including catalase was lower. Knockdown of XBP1 decreased catalase expression, enhanced ROS generation and MMP loss after H(2)O(2) exposure, but extrinsic catalase supply rescued them. Overexpression of XBP1 recovered catalase expression in XBP1-deficient cells and diminished ROS generation after H(2)O(2) exposure. Mutation analysis of the catalase promoter region suggests a pivotal role of CCAAT boxes, NF-Y-binding sites, for the XBP1-mediated enhancing effect. Taken together, these results indicate a protective role of XBP1 against oxidative stress, and its positive regulation of catalase expression may at least in part account for this function.


Figures

Figure 1
Figure 1
Cell death in H2O2-treated MEFs. (a) Trypan blue exclusion assay. Cell survival fraction of XBP1 +/+ (broken line) and −/− (thick line) MEF cells at 24 h after exposure to H2O2 at indicated doses (mM). **P<0.01 compared with +/+ cells. (b) Cell death at 24 h after H2O2 exposure (mM) with (closed bars) or without (open bars) pretreatment of 5 mM l-NAC for 2 h. In (a, b), error bars indicate the mean ± S.D. of data from three separate experiments. **P<0.01 compared with l-NAC untreated cells. (c) Disruption of Δψm. Cells were treated with 1 mM H2O2 for 12 h with or without 5 mM l-NAC pretreatment, incubated with DePsipher solution, and intracellular fluorescence was detected. Numbers indicate % of cells showing loss of Δψm
Figure 2
Figure 2
Cell death in PTL-treated MEFs. (a) Trypan blue exclusion assay. Cell survival fraction of XBP1 +/+ (broken line) and −/− (thick line) MEF cells at 24 h after treatment with PTL at indicated doses (µM). **P< 0.01 compared with +/+ cells. (b) Cell death at 24 h after PTL (µM), 25 µg/ml VP16 (VP) or 50 nM FK228 (FK) treatment with (closed bars) or without (open bars) pretreatment of 5 mM l-NAC for 2 h. In (a, b), error bars indicate the mean ± S.D. of data from three separate experiments. **P< 0.01 compared with l-NAC untreated cells. (c) Disruption of Δψm. Cells were treated with the indicated agents for 24 h as described in (b), incubated with DePsipher solution and intracellular fluorescence was detected. Numbers indicate % of cells showing loss of Δψm
Figure 3
Figure 3
Oxidative stress response. (a) ROS generation. Carboxy-H2DCFDA fluorescent signals in MEFs after treatment with 1 mM H2O2 for 1–3 h or 10–20 µM PTL for 12 h with or without 5 mM l-NAC pretreatment. In representative histograms, numbers indicate mean fluorescence intensity (MFI) of MEFs. *P<0.05, **P<0.01 compared with +/+ cells. (b) p38 and JNK phosphorylation. After incubation with 1 mM H2O2 or 20 µM PTL for the indicated hours, p38 and JNK activities were evaluated by western blots using anti-phosphorylated p38 and anti-phosphorylated JNK antibodies, respectively. (c) p38 phosphorylation inhibition by l-NAC. Prior to exposure to 1 mM H2O2, MEF cells were pretreated by 5 mM l-NAC (+) for 2 h. Anti-p38 and anti-JNK protein antibodies show equal loading of protein samples
Figure 4
Figure 4
Catalase expression. (a) Total RNAs were harvested from XBP1 +/+ and −/− MEF cells and transcripts of the indicated genes were evaluated by RT-PCR. Catalase transcripts were determined by real-time PCR and normalized to GAPDH levels (right panel). **P<0.01 compared with +/+ cells. (b) Total RNA (upper panel) and cell lysates (lower panel) were harvested from MEFs after treatment with 1 mM H2O2 for the indicated hours. The blot was re-probed with anti-14-3-3 antibody to demonstrate equal loading of protein samples. (c) ROS generation. Carboxy-H2DCFDA fluorescent signals in MEFs after treatment with 1 mM H2O2 for 3h. XBP1 +/+ cells were pretreated with 1 U catalase (mosaic bar), 1 U catalase plus 50 mM AT (closed bar) or without (open bar) for 2 h prior to H2O2 exposure. (d) Trypan blue exclusion assay. Cell death of XBP1 +/+ MEFs at 24 h after exposure to 1 mM H2O2 with (closed bar) or without (open bar) pretreatment with 50 mM AT for 2 h. In (c, d), **P<0.01 compared with AT-untreated cells. (e) Sub-G1 population. XBP1 +/+ MEFs were similarly treated as (d) and DNA content in each cell was detected by propidium iodide. Numbers indicate % of sub-G1 population. (f) p38 phosphorylation. After exposure to 1 mM H2O2 for 1–3 h with or without 50 mM AT pretreatment for 2 h, p38 activity in XBP1 +/+ MEFs was evaluated by western blots using anti-phosphorylated p38 and anti-p38 protein antibodies. (g) Total RNA was prepared from XBP1 +/+ MEFs treated with 1 mM thapsigargin for the indicated hours and each transcript was evaluated by RT-PCR. An arrow indicates the spliced form of XBP1. In (a, b, g), GAPDH mRNA levels ensure that the RNAs were correctly quantified. In (a, c, d), error bars indicate the mean ± S.D. of data from three separate experiments
Figure 5
Figure 5
XBP1 expression in vivo. (a) Total RNAs were harvested from a SCID mouse and transcripts of the indicated genes were evaluated by RT-PCR. GAPDH mRNA levels ensure that the RNAs were correctly quantified. (b) Western blot analysis of XBP1 and catalase expression in mouse (upper panel) and Wistar rat organs (lower panel). The blot was re-probed with anti-β-actin antibody to demonstrate equal loading of protein samples. (c) ROS generation. Carboxy-H2DCFDA fluorescent signals (MFI) in the indicated primary cells after treatment with H2O2 (mM) for 1 h. (d) Cell death of primary cells described in (c) assessed by 7-AAD. Cells were harvested at 4 h after exposure to 0.5 mM H2O2, and increased fluorescence indicates cell death. In (c, d), representative histograms are shown and numbers indicate MFI
Figure 6
Figure 6
Knockdown of XBP1 transcripts in HeLa cells. (a) RT-PCR. Total RNAs after twice transfection with siRandom (random), siXBP1 (XBP1) or siCatalase (catalase) and the indicated genes were investigated by RT-PCR. (b) Trypan blue exclusion assay. After transfection with siRandom or siCatalase, cells were exposed to 0.5 mM H2O2 (closed bars) for 10 h. Catalase knockdown was evaluated by western blot analysis. (c) RT-PCR. Total RNAs were harvested after transfection with siRandom (random) or three different siPERK (PERK) and the indicated genes were analyzed. In (a, c), GAPDH shows that the RNAs were correctly quantified. (d) Quantitative catalase transcripts after XBP1 knockdown. After siRandom (open bar) or siXBP1 (closed bar) transfection, catalase transcripts were determined by real-time PCR and normalized to GAPDH levels. (e) ROS generation. Carboxy-H2DCFDA fluorescent signals (MFI) in siRandom (broken line) or siXBP1 (thick line) transfectants after treatment with 0.5 mM H2O2 for 1–3h. Expression of the indicated proteins was evaluated by western blot (upper panel). In (b, d, e), *P<0.05, **P<0.01 compared with siRandom transfectants. (f) Disruption of Δψm. Cells were treated with 0.5 mM H2O2 for 12 h after four times transfection with siRandom or siXBP1 and MMP was measured. Numbers indicate % of cells showing loss of Δψm. (g) Prolonged p38 phosphorylation. After transfection as in (f), cells were exposed to 0.5 mM H2O2 for indicated hours and p38 phosphorylation was evaluated by western blot analysis. (h) Rescue by catalase supply. Upper panel: ROS generation at 3 h after 0.5 mM H2O2 in siRandom (open bar), siXBP1 (closed bar) and siXBP1 transfectants pretreated with 0.4 U catalase (mosaic bar) or 1 U SOD1 (striped bar). In siXBP1 transfectants, 0.4 U catalase decreased ROS generation similar to siRandom transfectants. Lower panel: cell death assessed by Trypan blue exclusion assay at 10 h after 0.5 mM H2O2. In (h), **P<0.01 compared with siXBP1 transfectants. In (b, d, e, h), error bars display the mean ± S.D. of data from three separate experiments
Figure 7
Figure 7
Overexpression of XBP1 and catalase reporter assays. (a) XBP1 overexpression. The indicated forms of XBP1 expression vectors were repeatedly transfected (2–3 times) into XBP1-deficient cells and total RNA (upper panel) and cell lysates (lower panel) were harvested at 7–10 days after first transfection. GAPDH mRNA levels ensure correctly quantified RNAs, whereas β-actin demonstrates equal loading of protein samples. (b) Effect of XBP1 overexpression on ROS generation. In MOCK (open bar), XBP1(U) (closed bar), XBP1(S) (striped bar) and XBP1(KKK) (mosaic bar) transfectants, ROS levels were measured at 3 h after 1 mM H2O2 exposure. (c) Effect of XBP1 overexpression on catalase transcription. XBP1-deficient MEFs were transiently co-transfected of the indicated pGL3-Enhancer reporter genes or its vehicle with MOCK (open bar) or XBP1(U) (closed bar). (d) Effect of XBP1(U) on catalase transcription in XBP1 +/+ and −/− MEFs. Both MEFs were co-transfected with the pGL3-Enhancer CAT(−191/+68) reporter gene and MOCK or XBP1(U), exposed to 1 mM H2O2 (closed bar) for 3 h and harvested. (e) Effect of XBP1 overexpression on pGL3-Basic CAT(−191/+68) reporter genes carrying mutation at the indicated sites. XBP1-deficient cells were transiently co-transfected with the indicated constructs plus XBP1(U) (closed bar) or vehicle (open bar). In (c–e), transcription activity was evaluated 48 h after transfection. Columns display the mean ± S.D. of data from three separate experiments and *P<0.05, **P<0.01 compared with MOCK-transfectants
Figure 8
Figure 8
Gel shift and immunoprecipitate assays. (a) The end-labeled catalase promoter probe was incubated with the nuclear extracts from XBP1 +/+ or −/− MEFs and loaded onto non-denaturing gel. The nuclear extract XBP1 (+/+) was preincubated with excess (1 : 100) of the cold probe DNA (S) or unrelated nonspecific DNA (NS). (b) The labeled catalase probe was incubated with the nuclear extracts from XBP1 −/− MEFs transfected with mock or XBP1(U). In (a, b), the same extracts were also incubated with the end-labeled AP2 probe for control study and the arrows indicate shifted bands (the largest complexes). (c) Western blot analysis. Expression of the indicated proteins in the cytoplasmic and nuclear fractions shown in (b) was evaluated by western blots. (d) Immunoprecipitation assays. Unlabeled catalase promoter probe (Pro), its mutant (mPro) or catalase coding region (Code) were incubated with the indicated nuclear extracts and immunoprecipitated with antibodies against XBP1, NF-YA or non-immunized rabbit serum (−). The immunoprecipitates were amplified by corresponding primers. A fixed portion of the total input was also examined by PCR (INPUT)

Similar articles

Cited by

References

    1. Cooke MS, Evans MD, Dizdaroglu M, Lunec J. Oxidative DNA damage: mechanisms, mutation, and disease. FASEB J. 2003;17:1195–1214. - PubMed
    1. Finkel T, Holbrook NJ. Oxidants, oxidative stress and the biology of ageing. Nature. 2000;408:239–247. - PubMed
    1. Klein JA, Ackerman SL. Oxidative stress, cell cycle, and neurodegeneration. J Clin Invest. 2003;111:785–793. - PMC - PubMed
    1. Deisseroth A, Dounce AL. Catalase: Physical and chemical properties, mechanism of catalysis, physiological role. Physiol Rev. 1970;50:319–375. - PubMed
    1. Schisler NJ, Singh SM. Inheritance and expression of tissue-specific catalase activity during development and aging in mice. Genome. 1987;29:748–760. - PubMed

Publication types

MeSH terms

LinkOut - more resources