. 2009 Feb;5(2):e1000392.
doi: 10.1371/journal.pgen.1000392. Epub 2009 Feb 27.

Gene dosage effects of the imprinted delta-like homologue 1 (dlk1/pref1) in development: implications for the evolution of imprinting

Affiliations

Gene dosage effects of the imprinted delta-like homologue 1 (dlk1/pref1) in development: implications for the evolution of imprinting

Simao Teixeira da Rocha et al. PLoS Genet. 2009 Feb.

Abstract

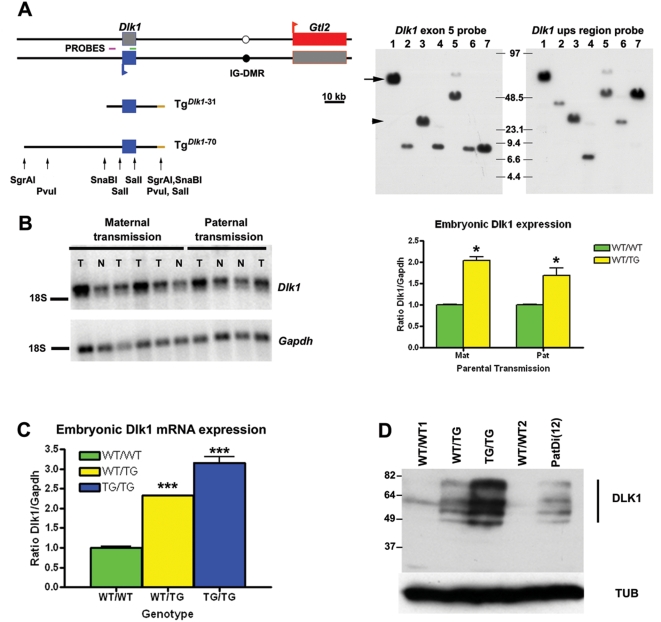
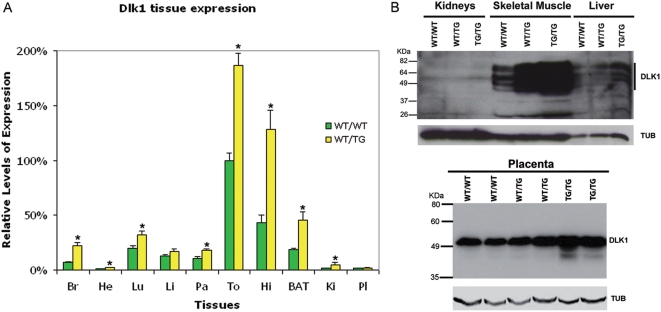
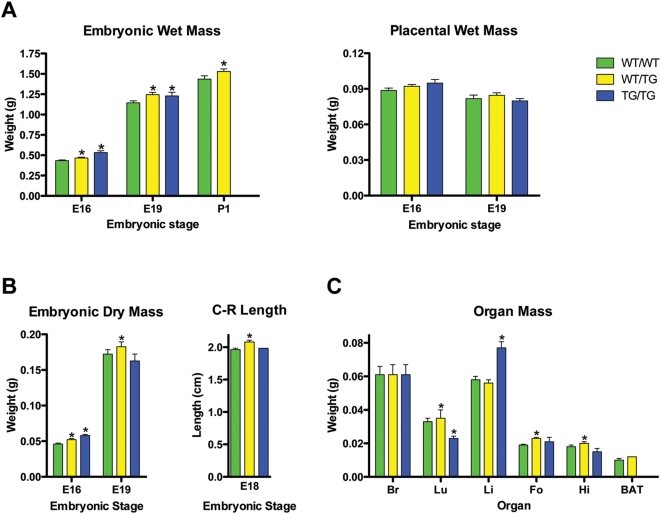
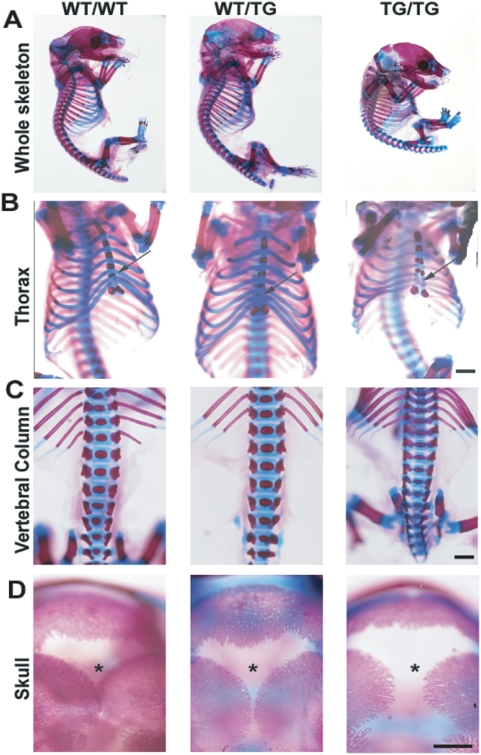
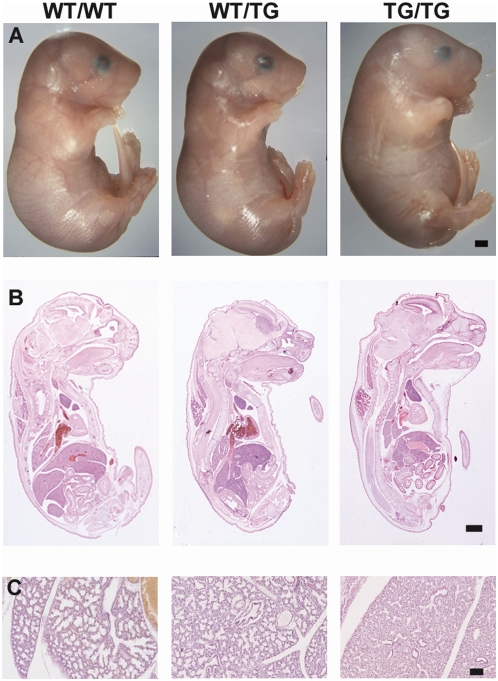
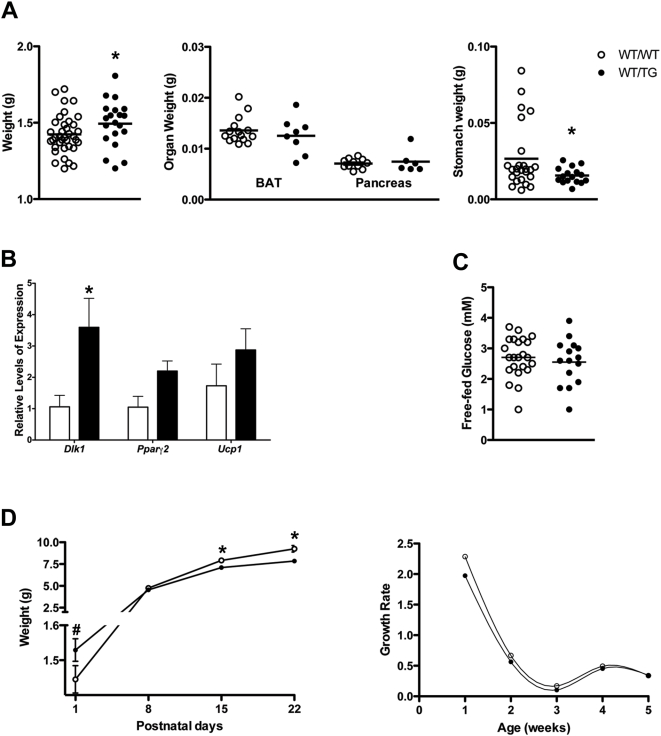
Genomic imprinting is a normal process that causes genes to be expressed according to parental origin. The selective advantage conferred by imprinting is not understood but is hypothesised to act on dosage-critical genes. Here, we report a unique model in which the consequences of a single, double, and triple dosage of the imprinted Dlk1/Pref1, normally repressed on the maternally inherited chromosome, can be assessed in the growing embryo. BAC-transgenic mice were generated that over-express Dlk1 from endogenous regulators at all sites of embryonic activity. Triple dosage causes lethality associated with major organ abnormalities. Embryos expressing a double dose of Dlk1, recapitulating loss of imprinting, are growth enhanced but fail to thrive in early life, despite the early growth advantage. Thus, any benefit conferred by increased embryonic size is offset by postnatal lethality. We propose a negative correlation between gene dosage and survival that fixes an upper limit on growth promotion by Dlk1, and we hypothesize that trade-off between growth and lethality might have driven imprinting at this locus.


Conflict of interest statement

The authors have declared that no competing interests exist.

Figures

Figure 1
Figure 1. Generation of Dlk1 transgenic mice.
A. Two different BAC transgenes containing the Dlk1 gene. The left panel displays a schematic representation of the two BAC transgenes containing Dlk1 presented in this study: TgDlk1 -31 and TgDlk1 -70. TgDlk1 -31 did not express the transgene and was not further analysed. Red box - maternally expressed gene Gtl2; blue box – paternally expressed gene Dlk1; white circle – unmethylated IG-DMR; black circle – methylated IG-DMR; brown line – vector sequence; Probes: violet line – Dlk1 upstream region probe, green line – Dlk1 exon 5 probe. The right panel contains representative Southern hybridizations of the restriction enzyme fragments of the BAC 153O05 clone from where TgDlk1 -31 (arrowhead) and TgDlk1 -70 (arrow) were obtained by restriction digestion; the two probes were used to confirm the presence of appropriate restriction fragments containing the Dlk1 gene and upstream sequences within the transgene. Lane 1: SgrAI; Lane 2: SgrAI+SalI; Lane 3: SnaBI; Lane 4: SnaBI+SalI; Lane 5: PvuI; Lane 6: PvuI+SalI; Lane 7: SalI. B. Expression of Dlk1 in transgene hemizygotes is independent of parental inheritance of the transgene. Quantitative Northern Blot showing that Dlk1 is over-expressed upon both maternal and paternal transmission of the TgDlk1 -70 transgene in E16 70C fetuses. The graph represents mean normalized Dlk1 expression±SEM (ratio: Dlk1/Gapdh) from WT/TG and WT/WT littermates upon maternal or paternal transmission of the transgene. Significant differences between the WT/TG and WT/WT littermates are indicated by asterisks (p-value<0.05, unpaired Student's t test); Abbreviations: N – WT/WT fetus; T – WT/TG fetus; Mat – maternal transmission; Pat – paternal transmission. C. Double and triple dosage of Dlk1 in hemizygous and homozygous TgDlk1 -70 transgenic mice. The graph on the left represents normalized Dlk1 expression from E16 70B WT/WT, WT/TG and TG/TG fetuses from heterozygous intercrosses obtained by Northern Blot analysis (as in B). Significant differences between the WT/TG and WT/WT and between TG/TG and WT/WT are indicated by asterisks (p-value<0.01, unpaired Student's t test; n≥4 for all genotypes). D. Comparative DLK1 protein levels in transgenic and PatDi(12) E16 70B fetuses and control littermates were evaluated by Western Blot (right panel). Antibodies used were anti-DLK1 and anti α-TUBULIN (TUB) as a normalization control. Comparable protein isoforms are evident between WT/WT and the transgenic animals on longer exposure.
Figure 2
Figure 2. TgDlk1 -70 transgene recapitulates the expression of the endogenous locus in embryonic tissues but not in the placenta.
A. Dlk1 tissue expression analysis by TaqMan RT-qPCR shown for E18. Graphic representation of relative mean Dlk1 expression in WT/WT and WT/TG tissues normalized to 100% E18 WT/WT tongue expression±SEM (n≥5). Data is shown for the 70B family. Significant differences between WT/TG and WT/WT for each tissue at each embryonic stage are indicated by asterisks on top of the WT/TG bar (p-value<0.05; unpaired Student's t test). Fold differences between wild-type and transgenic conceptuses are: Br: 3.21×±0.37 of Dlk1 WT/WT expression; He: 2.55×±0.35; Lu: 1.61×±0.20, Li: 1.31×±0.21 NS; Pa: 1.65×±0.14; To: 1.87×±0.11, He: 2.99×±0.4, BAT: 2.41×±0.44; and Ki: 2.49×±0.21; Pla: 1.09×±0.15 Abbreviations: Br – brain; He – heart; Lu – lungs; Li – liver; Pa – pancreas; To – tongue; Hi – hindlimbs; BAT – Brown adipose tissue; Kid – kidneys; Pla – placenta. B. DLK1 protein levels in transgenic and wild-type tissues. Western blot analysis of DLK1 protein levels in E18 70B transgenic and WT/WT liver, muscle and kidney (negative control) and E16 placenta. For placenta, values normalised against tubulin are as follows: WT/WT = 1.00±0.017; WT/TG = 1.183±0.051 and TG/TG = 1.533*±0.073 (*for TG/TG p = 0.0417; paired non-parametric Freidman test). Antibodies used were anti-DLK1(DLK1) and anti α-TUBULIN (TUB) as a normalization control.
Figure 3
Figure 3. Transgenic expression in embryos recapitulates endogenous expression.
A. WT/WT (left and middle) and TG/TG (right) e16 70B embryos were sectioned, then in-situ hybridisation was performed using sense control (left panel) and antisense probes to Dlk1 (exons 3 to 5, middle and right panels). No ectopic expression was observed. 2.5× magnification. B. High power images of WT/WT (left) and TG/TG (right) kidney (20×, top), neck (10×) and lung (40×). In the WT/WT kidney, Dlk1 is largely absent except in the capsule and some punctuate staining in the mesenchyme. This pattern is recapitulated in the TG/TG, with greater intensity. In the neck, Dlk1 is expressed in the ossifying cartilage of the spinal cord, in the muscle and in the brown adipose tissue deposits, in both the WT/WT and TG/TG. In WT/WT lung Dlk1 is expressed in the epithelium of branching alveoli and in the mesenchyme. This pattern is also clearly present in the TG/TG.
Figure 4
Figure 4. Dlk1 over-expression causes tissue-specific growth enhancement.
(A) Embryonic and placental growth of wild-type and transgenic conceptuses and (B) embryonic dry masses and crown-rump lengths were measured from fetuses derived from heterozygous intercrosses (n≥5 litters; n≥9 animals per genotype). Graphs represent mean values for each genotype within a litter±SEM for multiple litters. Significant differences from wild-type are indicated by asterisks (p-value<0.05, paired, nonparametric Wilcoxon's test). (C) Wet mass of E18 brain (Br), lungs (Lu), liver (Li), forelimbs (Fo) and hindlimbs (Hi) and E19 brown adipose tissue (BAT) were measured in WT/WT, WT/TG and TG/TG fetuses (n≥3 litters; n≥10 animals per genotype, except TG/TG forelimbs and hindlimbs where n = 4). Graph represents mean weight±SEM per genotype. Significant differences from wild-type are indicated by asterisks on top of the WT/TG or TG/TG bar (p-value<0.05, unpaired Student's t test). Data shown in this figure are combined results from 70A, 70B and 70C.
Figure 5
Figure 5. Skeletal defects in E19 WT/TG and TG/TG fetuses.
A, Sagittal view of the whole skeleton. B, Frontal view of the thoracic cage. C, Dorsal view of the vertebrae in the dorsal zone and D, cranial view of the skull of E19 WT/WT, WT/TG and TG/TG skeletons stained with Alcian Blue/Alizarin Red. Arrow in B indicates the fifth ossification centre in the WT/WT sternum, absent in the WT/TG and TG/TG skeleton. Asterisk in D marks the closure of the sagittal suture. Scale bars: 0.5 mm (B and C) and 1 mm (D). All images shown A–D are derived from 70A animals; results are exactly the same for 70B and 70C.
Figure 6
Figure 6. TG/TG fetuses exhibit major developmental abnormalities.
A. E19 WT/WT WT/TG and TG/TG fetuses. B. Comparable mid-sagittal H&E sections through E18 WT/WT, WT/TG, and TG/TG fetuses. C. H&E stained sections through E18 lungs showing dense cellular arrangement in TG/TG lung. Sections shown are from 70A animals; results are the same for 70B and 70C. N±3 samples from each genotype were analysed for each line. Scale bar in A and B: 1 mm; Scale bar in C: 100 µm.
Figure 7
Figure 7. Poor early post-natal fitness in animals with Dlk1 double dose.
A. Neonatal total mass (left panel) and organ weights (right panels) at birth (P1). Graphs represent weight of individual animals/organs. Significant differences from wild-type are indicated by asterisks on top of the WT/TG (p-value<0.05, unpaired Student's t test). For stomach weights, the non-parametric Mann-Whitney U-test was performed (p-value<0.05). B. BAT expression analysis by TaqMan RT-qPCR. Graphic representation of relative levels of expression of Dlk1, Pparγ2 and Ucp1 normalized against 18S (loading control) at P1 (mean±SEM, n≥4). Significant differences between WT/TG and WT/WT for each gene are indicated by asterisks on top of the WT/TG bar (p-value<0.05; unpaired Student's t test). C. Free-fed glycemia at P1; Graph represents individual levels of glycemia (n≥15). D. The left panel represents the pre-weaning growth curve of WT/WT and WT/TG male juveniles. Graph represents mean values±SEM per genotype (n≥7). Significant reduced weight from WT/WT is indicated by # and significant increased weight from WT/WT is indicated by * (p-value<0.05, unpaired Student's t test). The right panel shows the growth rate of WT/WT and WT/TG animals in the first 5 weeks of age (calculated using the following formula: for week n: [weight at week n – weight at week (n-1)]/weight at week n. All data shown in A–D are the combined results for the three transgenic lines.

References

    1. da Rocha ST, Ferguson-Smith AC. Genomic imprinting. Curr Biol. 2004;14:R646–649. - PubMed
    1. Schmidt JV, Matteson PG, Jones BK, Guan XJ, Tilghman SM. The Dlk1 and Gtl2 genes are linked and reciprocally imprinted. Genes Dev. 2000;14:1997–2002. - PMC - PubMed
    1. Takada S, Tevendale M, Baker J, Georgiades P, Campbell E, et al. Delta-like and Gtl2 are reciprocally expressed, differentially methylated linked imprinted genes on mouse chromosome 12. Curr Biol. 2000;10:1135–1138. - PubMed
    1. Smas CM, Sul HS. Pref-1, a protein containing EGF-like repeats, inhibits adipocyte differentiation. Cell. 1993;73:725–734. - PubMed
    1. Baladron V, Ruiz-Hidalgo MJ, Nueda ML, Diaz-Guerra MJ, Garcia-Ramirez JJ, et al. Dlk acts as a negative regulator of Notch1 activation through interactions with specific EGF-like repeats. Exp Cell Res. 2005;303:343–359. - PubMed

Publication types

MeSH terms

Substances