. 2009 Feb;5(2):e1000313.
doi: 10.1371/journal.ppat.1000313. Epub 2009 Feb 27.

Synergistic reversal of intrahepatic HCV-specific CD8 T cell exhaustion by combined PD-1/CTLA-4 blockade

Affiliations

Synergistic reversal of intrahepatic HCV-specific CD8 T cell exhaustion by combined PD-1/CTLA-4 blockade

Nobuhiro Nakamoto et al. PLoS Pathog. 2009 Feb.

Abstract

Viral persistence is associated with hierarchical antiviral CD8 T cell exhaustion with increased programmed death-1 (PD-1) expression. In HCV persistence, HCV-specific CD8 T cells from the liver (the site of viral replication) display increased PD-1 expression and a profound functional impairment that is not reversed by PD-1 blockade alone. Here, we report that the inhibitory receptor cytotoxic T lymphocyte-associated antigen-4 (CTLA-4) is preferentially upregulated in PD-1(+) T cells from the liver but not blood of chronically HCV-infected patients. PD-1/CTLA-4 co-expression in intrahepatic T cells was associated with a profound HCV-specific effector dysfunction that was synergistically reversed by combined PD-1/CTLA-4 blockade in vitro, but not by blocking PD-1 or CTLA-4 alone. A similar effect was observed in circulating HCV-specific CD8 T cells with increased PD-1/CTLA-4 co-expression during acute hepatitis C. The functional response to combined blockade was directly associated with CTLA-4 expression, lost with CD28-depletion and CD4-independent (including CD4(+)FoxP3(+) Tregs). We conclude that PD-1 and CTLA-4 pathways both contribute to virus-specific T cell exhaustion at the site of viral replication by a redundant mechanism that requires combined PD-1/CTLA-4 blockade to reverse. These findings provide new insights into the mechanisms of virus-specific T cell dysfunction, and suggest that the synergistic effect by combined inhibitory receptor blockade might have a therapeutic application against chronic viral infection in vivo, provided that it does not induce autoimmunity.


Conflict of interest statement

G.J.F. has a patent licensing arrangement for antibodies blocking the PD-1/PD-L pathways.

Figures

Figure 1
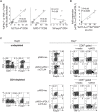
Figure 1. CTLA-4 expression is increased in intrahepatic HCV-specific CD8 T cells.
(A) %CTLA-4+ in CD8 T cells from 29 chronic (C), 6 acute (A) and 4 resolved (R) hepatitis C patients and 10 HCV-seronegative controls (N). Median: C (blood 1.6%, liver 6.4%); R 1.3%; N 0.9%; A 10.6%. (B) CTLA-4 expression in tetramer+ CD8 T cells specific for HLA-A2-restricted HCV (NS3 1073, NS3 1406, NS5 2594) and non-HCV (Flu, CMV and EBV) epitopes from 11C, 3R and 4A patients. Median CTLA-4 MFI: C (blood: HCV 77, non-HCV 61; liver: HCV 151, non-HCV 43). Median %CTLA-4+: C (blood: HCV 1.4%, non-HCV 0.9%; liver: HCV 22.2%, non-HCV 0.6%); R (HCV 0.6%, non-HCV 0%); A (HCV 14.0%, non-HCV 2.9%). Red horizontal bars indicate median value. P-values were determined by Mann-Whitney U test. (C) Representative flow cytometry plots. (Top): Staining characteristics of tetramer+ CD8 T cells. (Middle): PD-1/CTLA-4 staining of gated tetramer+ CD8 T cells (dot plots). (Bottom): PD-1 and CTLA-4 cutoff strategy based on the isotype. (D) Representative FACS plots showing preferential CTLA-4 expression in PD-1-high cells (left) and cutoff strategy based on the isotype (left) in intrahepatic CD8-gated T cells demonstrated with PE-conjugated αPD-1 mAb. (E) Correlation between PD-1 and CTLA-4 expressions in HCV-specific tetramer+ CD8 T cells ex vivo from HCV-seropositive subjects. Red circles: HCV-specific CD8 T cells from HCV-infected liver and peripheral blood of acute HCV patients.
Figure 2
Figure 2. PD-1+CTLA-4+ CD8 T cells from HCV-infected liver highly express CD28 but not ICOS or BTLA.
(A) CD28 expression by percentage and MFI in total CD8 T cells from blood and in liver-derived CD8 T cell subsets (PD-1CTLA-4, PD-1+CTLA-4, PD-1+CTLA-4+) ex vivo from 18 chronic HCV patients. Median values (red horizontal lines): %CD28+ in intrahepatic PD-1CTLA-4 vs. PD-1+CTLA-4 vs. PD-1+CTLA-4+ subsets (33% vs. 49% vs. 62%, p<0.0001 by the Kruskal Wallis test). (B) BTLA and ICOS expressions by percentage and MFI in total CD8 T cells from blood and in liver-derived CD8 T cell subsets (PD-1CTLA-4, PD-1+CTLA-4, PD-1+CTLA-4+) ex vivo from 5 chronic HCV patients. Median values (red horizontal lines): %BTLA+ (intrahepatic CD8 subsets: 0.1% vs. 0.4% vs. 0.3%, p = 0.364); %ICOS+ (intrahepatic CD8 subsets: 0.1% vs. 0.5% vs. 2.4%, p = 0.049); ICOS MFI (intrahepatic CD8 subsets: 43 vs. 50 vs. 78, p = 0.021). The p-values were calculated by the Kruskal Wallis test. Flow cytometry plots on the right show the characteristic PD-1 and CTLA-4 expression in intrahepatic CD8 T cells (left) and the relative CD28, BTLA and ICOS expression in PD-1+CTLA-4+ (Red), PD-1+CTLA-4 (Green) and PD-1CTLA-4 (Blue) CD8 T cell subsets relative to isotype control (gray shade) in the histograms on the right.
Figure 3
Figure 3. Intrahepatic HCV-specific T cell dysfunction can be reversed synergistically by combined PD-1/CTLA-4 blockade.
(A) Effect of inhibitory receptor blockade on HCV-specific IFN-γ and TNF-α production by CD8 and CD4 T cells from liver and blood. The bar graphs show the frequency of CD8 (upper graphs) and CD4 (lower graphs) T cells with HCV-specific intracellular IFN-γ and/or TNF-α expression in liver-derived (left panel, n = 6) and blood-derived (right panel, n = 8) lymphocytes isolated from chronic HCV patients and cultured for 7 days in vitro with 15mer overlapping peptides spanning the entire HCV NS3 protein (pNS3) in the presence of isotype control or blocking antibodies. The 7-day cultures were further stimulated for 6 hours with media alone or with pNS3 before intracellular IFN-γ and TNF-α staining. The %IFN-γTNF-α+ (blue bar), %IFN-γ+TNF-α+ (red bar) and %IFN-γ+TNF-α (yellow bar) T cells are stacked together in each case to show total cytokine+ cells. (B) Representative flow cytometry plots showing HCV NS3 and Flu-specific IFN-γ and TNF-α production in vitro in liver-derived CD8 T cells from chronic HCV patient C21 following 7 days of culture with NS3 or Flu-derived peptides in the presence of isotype or blocking antibodies. Flow cytometry plots on the far left shows the PD-1 and CTLA-4 expression in liver-derived CD8 T cells directly ex vivo.
Figure 4
Figure 4. Effect of PD-1/CTLA-4 blockade on intrahepatic and peripheral HCV-specific tetramer+ CD8 T cell function.
Flow cytometry plots showing HCV 1073-specific CD8 T cell phenotype directly ex vivo and antigen-specific functions following 7 days of antigenic stimulation in the presence of isotype or blocking antibodies, using liver-derived (A) and blood-derived (B) lymphocytes from chronic patient C57. (Top panels): frequency of HCV 1073-specific CD8 T cells determined by cognate HLA-A2 tetramer staining. (Middle panels) far left: PD-1 and CTLA-4 expression ex vivo in gated tetramer+ CD8 T cells (dot plots). Remaining right panels: HCV-specific IFN-γ production and CD107a mobilization in gated tetramer+ CD8 T cells on day 7. (Bottom panels): Perforin expression in tetramer+ (blue line) and total CD8 T cells (gray shaded) on day 7. (C) Fold increase in the expansion and effector functions of liver-derived (left) and blood-derived (right) HCV-specific CD8 T cells by αPD-L1 alone (white bar), αCTLA-4 alone (gray bar) and combined αPD-L1/αCTLA-4 blockade (black bar) relative to the isotype control for 3 chronic patients. The frequencies of functional tetramer+ CD8 T cells in each culture were calculated by multiplying %tetramer+ CD8 T cells with %IFN-γ+/tetramer+ CD8 T cells, %perforin+/tetramer+ CD8 T cells or %CD107a+/tetramer+ CD8 T cells. (D) Flow cytometry plots showing CMV-specific CD8 T cells directly ex vivo and their antigen-specific functions following 7 days in vitro cultures from chronic patient C99.
Figure 5
Figure 5. PD-1/CTLA-4 blockade can rejuvenate circulating PD-1+CTLA-4+ HCV-specific CD8 T cells during acute hepatitis C.
(Left panels): Flow cytometry plots showing peripheral HCV-specific tetramer+ CD8 T cells during acute hepatitis C in patients A29 (A) and A35 (B) ex vivo. Gated tetramer+ CD8 T cells (dot plots) exhibit increased PD-1 and CTLA-4 expression. (Right panels): Flow cytometry plots showing HCV-specific tetramer+ CD8 T cell frequency following 7 days of culture with antigenic peptide in the presence of isotype or blocking antibodies for A29. In A35, HCV-specific tetramer+ CD8 T cell proliferation was directly monitored in CFSE dilution assay (gating on CD8 T cells) in which the events on the left upper quadrant represent tetramer+ CD8 T cells that expanded with CFSE-dilution.
Figure 6
Figure 6. The functional response to PD-1/CTLA-4 blockade associate directly with CTLA-4 expression but not FoxP3+ Tregs.
(A) Correlation between HCV specific effector cytokine response to combined PD-1/CTLA-4 blockade and ex vivo %CTLA-4+/CD8 but not %PD-1+/CD8 and %FoxP3+/CD4. The y-axis represents the sum of CD8 T cells with HCV-specific IFN-γ+TNF-α+, IFN-γ+TNF-α and IFN-γTNF-α+ expression during combined PD-1/CTLA-4 blockade from 14 HLA-A2 patients (6 intrahepatic and 8 peripheral blood responses). R and p-values by the Spearman rank correlation test. (B) Positive correlation between fold expansion of HCV-specific tetramer+ CD8 T cells with combined PD-1/CTLA-4 blockade (relative to PD-1 blockade alone) and ex vivo %CTLA-4+ in HCV-specific tetramer+ CD8 T cells in 7 HLA A2+ HCV-infected patients. R- and p-values by the Spearman rank correlation test. (C) (Left): Liver infiltrating lymphocytes from chronic patient C07 are examined for CD4, CD8 and FoxP3+ T cell subsets before (upper) and after (lower) depletion of CD4 T cells by CD4 Dynabeads (Dynal Inc), resulting in >99% depletion of CD4 T cells including FoxP3+ CD4 T cells. (Right): Undepleted and CD4-depleted liver infiltrating lymphocytes were cultured for 7 days with overlapping HCV NS3-derived 15mer peptides (pNS3) in the presence of isotype or blocking antibodies before direct staining for T cell subsets (CD4, FoxP3) and following additional 6 hours of stimulation with media alone (negative control) or pNS3 peptides to examine HCV-specific intracellular IFN-γ and TNF-α expression in CD8 T cells. Combined PD-1/CTLA-4 blockade promoted markedly enhanced HCV-specific cytokine response in undepleted and CD4-depleted cultures regardless of FoxP3+ Tregs.
Figure 7
Figure 7. The functional restoration by PD-1/CTLA-4 blockade is CD28-dependent.
(A) Loss of HCV-specific CD8 T-cell IFN-γ response by CD28 depletion. LIL or PBL from 3 HLA-A2-negative patients with chronic (C08, C275) and acute (A36) hepatitis C were depleted of CD4 without or with additional CD28 depletion before in vitro culture for 7 days with HCV NS3-derived overlapping 15mer peptides in the presence of isotype or PD-1/CTLA-4 blockade. Cultured cells were examined for HCV-specific IFN-γ production in a 45 hour IFN-γ ELISPOT assay. (B) CD28 expression in HCV-specific NS3 1073-specific tetramer+ CD8 T-cells relative to PD-1 and CTLA-4 expression ex vivo. (left) Peripheral HCV 1073-specific tetramer+ CD8 T cells from an HLA-A2+ acute HCV patient (A47) display CD28 expression in 28%. (middle) Gated HCV 1073-specific tetramer+ CD8 T cells show the characteristic PD-1 (97.3%) and CTLA-4 (20.5%) expression. (right) Increased CD28 expression in gated PD-1+CTLA-4+ (Red; 50.0%) HCV tetramer+ CD8 T cells compared to PD-1+CTLA-4 (Green; 19.5%) and PD-1CTLA-4 (Blue; 12.2%) subsets and isotype control (gray shade) in histogram. (C) Effect of CD28-depletion on antigen-specific expansion in the presence of PD-1 and/or CTLA-4 blockade is shown by CFSE-dilution for HCV NS3 1073-specific tetramer+ CD8 T cells from patient A47. CD4 depleted PBL with and without CD28-depletion were CFSE-labeled and stimulated for 7 days in vitro with HCV NS3 1073 peptide in the presence of isotype or blocking antibodies before flow cytometric analysis. Note that HCV tetramer+ CD8 T cells remain detectable with CD28 depletion in the bottom graphs.

Similar articles

Cited by

References

    1. Wherry EJ, Ahmed R. Memory CD8 T-cell differentiation during viral infection. J Virol. 2004;78:5535–5545. - PMC - PubMed
    1. Freeman GJ, Wherry EJ, Ahmed R, Sharpe AH. Reinvigorating exhausted HIV-specific T cells via PD-1-PD-1 ligand blockade. J Exp Med. 2006;203:2223–2227. - PMC - PubMed
    1. Maier H, Isogawa M, Freeman GJ, Chisari FV. PD-1:PD-L1 interactions contribute to the functional suppression of virus-specific CD8+ T lymphocytes in the liver. J Immunol. 2007;178:2714–2720. - PubMed
    1. Barber DL, Wherry EJ, Masopust D, Zhu B, Allison JP, et al. Restoring function in exhausted CD8 T cells during chronic viral infection. Nature. 2006;439:682–687. - PubMed
    1. Petrovas C, Casazza JP, Brenchley JM, Price DA, Gostick E, et al. PD-1 is a regulator of virus-specific CD8+ T cell survival in HIV infection. J Exp Med. 2006;203:2281–2292. - PMC - PubMed

Publication types

MeSH terms