. 2010 Feb;39(3):405-14.
doi: 10.1007/s00249-009-0413-5. Epub 2009 Feb 27.

A two-dimensional spectrum analysis for sedimentation velocity experiments of mixtures with heterogeneity in molecular weight and shape

Affiliations

A two-dimensional spectrum analysis for sedimentation velocity experiments of mixtures with heterogeneity in molecular weight and shape

Emre Brookes et al. Eur Biophys J. 2010 Feb.

Abstract

We report a model-independent analysis approach for fitting sedimentation velocity data which permits simultaneous determination of shape and molecular weight distributions for mono- and polydisperse solutions of macromolecules. Our approach allows for heterogeneity in the frictional domain, providing a more faithful description of the experimental data for cases where frictional ratios are not identical for all components. Because of increased accuracy in the frictional properties of each component, our method also provides more reliable molecular weight distributions in the general case. The method is based on a fine grained two-dimensional grid search over s and f/f (0), where the grid is a linear combination of whole boundary models represented by finite element solutions of the Lamm equation with sedimentation and diffusion parameters corresponding to the grid points. A Monte Carlo approach is used to characterize confidence limits for the determined solutes. Computational algorithms addressing the very large memory needs for a fine grained search are discussed. The method is suitable for globally fitting multi-speed experiments, and constraints based on prior knowledge about the experimental system can be imposed. Time- and radially invariant noise can be eliminated. Serial and parallel implementations of the method are presented. We demonstrate with simulated and experimental data of known composition that our method provides superior accuracy and lower variance fits to experimental data compared to other methods in use today, and show that it can be used to identify modes of aggregation and slow polymerization.


Figures

Fig. 1
Fig. 1
a Initial grid spanning entire s and k parameter space with a sparse representation of each parameter dimension. b Grid evaluation points after one iteration of grid movements. Black initial grid. Purple grid displacement by δk. Blue grid displacement by δs. White grid displacement by δs and δk. c Typical storage grid S for a heterogeneous sample after one iteration of grid displacements; darkness of points indicates concentration level; white indicates zero concentration, pink indicates a small concentration, while dark purple indicates high concentration. Solutes get returned with discrete values of s and k
Fig. 2
Fig. 2
2DSA Monte Carlo analysis of velocity data from a mixture of a 208 bp DNA fragment (black lines) and hen egg lysozyme (blue lines). Heavy lines indicate the mean, thin lines represent 95% confidence intervals for the parameter. The results for several parameters from multiple grid resolutions are compared. a Frictional ratio; b sedimentation coefficient (corrected to standard conditions); c molecular weight, horizontal lines indicate theoretical molecular weight based on sequence; d partial concentration and the residual mean square deviation of the fit (red line). Reliable results are obtained after a minimum of 10,000 iterations, higher resolutions do not improve the results significantly
Fig. 3
Fig. 3
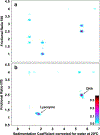
Pseudo-3D plots for solute distributions for the 2DSA Monte Carlo results shown in Fig. 2 for the highest and lowest grid resolution examined. a Grid resolution of 100 solutes; b grid resolution of 90,000 solutes. At the low resolution the composition is poorly defined and solute peaks are split, at high-resolution both species are well defined in narrow regions without any significant peak splitting, noise contributions are well separated and identifiable at the upper frictional ratio fitting limit k=4. Globular shape of lysozyme and elongated shape of DNA is clearly reproduced by fitting result. The color scale represents the signal of each species in optical density units
Fig. 4
Fig. 4
Pseudo-3D plots for Monte Carlo 2DSA analysis results for a simulated five component system described in Sect. 3.2. a Single speed fit of data from conventional centerpiece (10 krpm); b single speed fit of data from conventional centerpiece (60 krpm); c global multi-speed fit of data from conventional centerpiece (10, 30 and 60 krpm); d global multi-speed fit of data from both conventional centerpiece combined with data from band-forming Vinograd centerpiece (10, 30 and 60 krpm for both centerpiece types). Improvement of the results is apparent in reduced peak splitting and improved confidence intervals in going from a → d. Yellow crosses indicate the positions of the known solutes that were simulated for the original data. The color scale represents the signal of each species in optical density units

References

    1. Brookes EH, Demeler B (2006) Genetic algorithm optimization for obtaining accurate molecular weight distributions from sedimentation velocity experiments. In: Wandrey C, Cölfen H (eds) Analytical ultracentrifugation VIII, Springer Progr Colloid Polym Sci 131:78–82
    1. Brookes EH, Demeler B (2007) Parsimonious regularization using genetic algorithms applied to the analysis of analytical ultracentrifugation experiments. GECCO proceedings ACM 978–1-59593–697-4/07/0007
    1. Brookes EH, Boppana RV, Demeler B (2006) Computing large sparse multivariate optimization problems with an application in biophysics. Supercomputing ‘06 ACM 0–7695-2700–0/06
    1. Brown PH, Schuck P (2006) Macromolecular size-and-shape distributions by sedimentation velocity analytical ultracentrifugation. Biophys J 90(12):4651–4661. doi: 10.1529/biophysj.106.081372 - DOI - PMC - PubMed
    1. Cao W, Demeler B (2005) Modeling analytical ultracentrifugation experiments with an adaptive space-time finite element solution of the Lamm equation. Biophys J 89(3):1589–1602. doi: 10.1529/biophysj.105.061135 - DOI - PMC - PubMed

Publication types

LinkOut - more resources