

Single nucleotide polymorphisms affect both cis- and trans-eQTLs
- PMID: 19248827
- PMCID: PMC4041081
- DOI: 10.1016/j.ygeno.2009.01.011
Single nucleotide polymorphisms affect both cis- and trans-eQTLs
Abstract
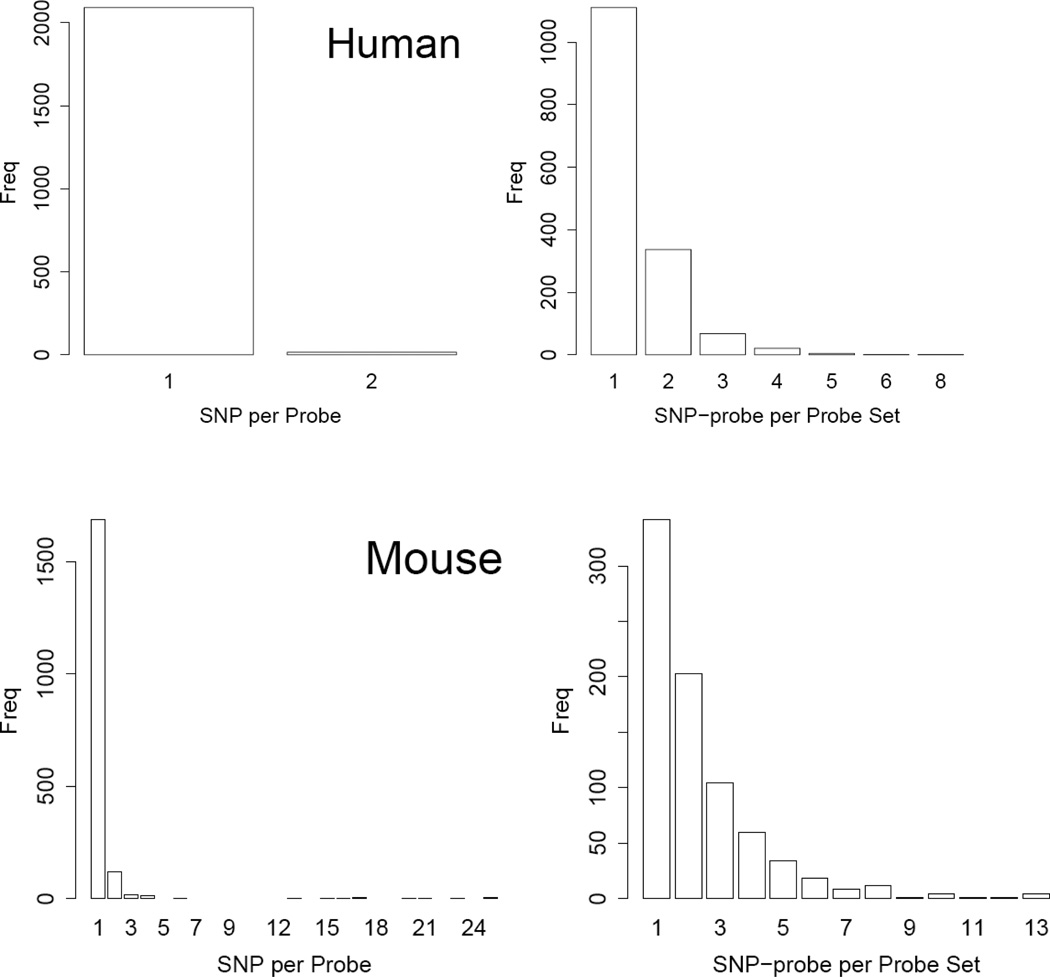
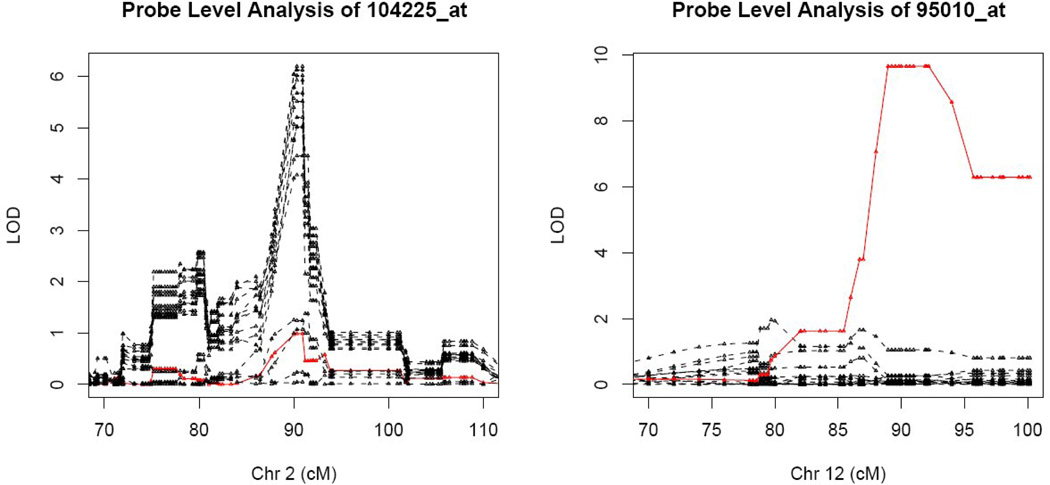
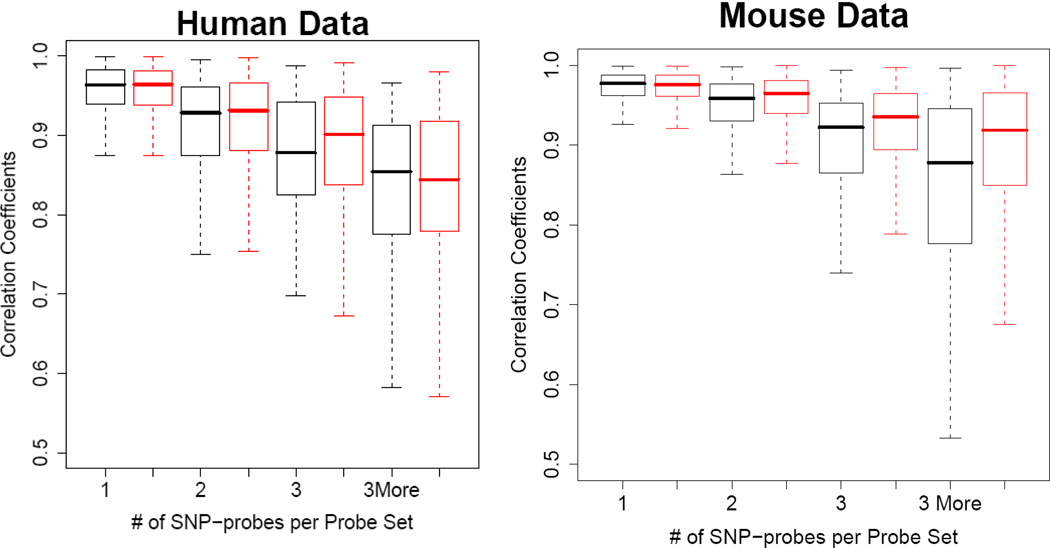
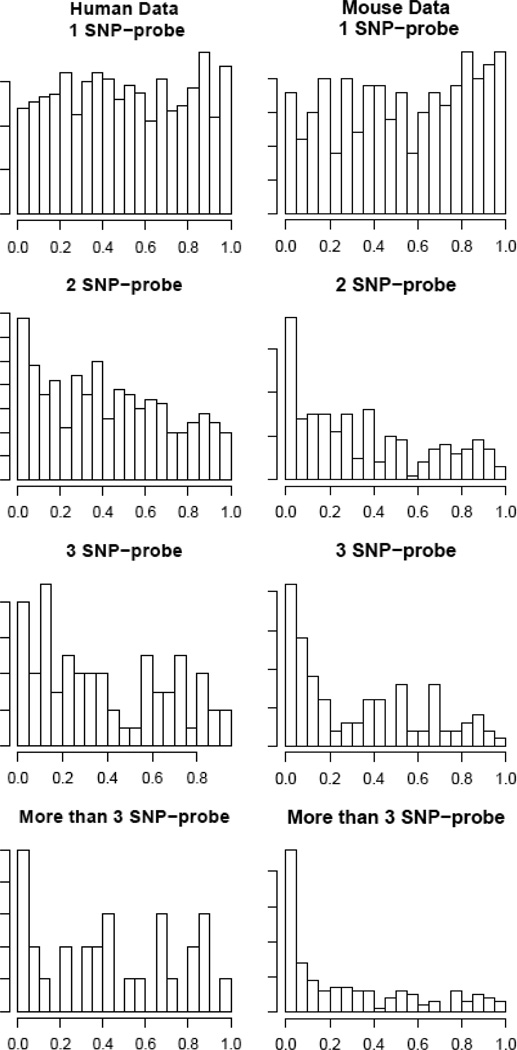
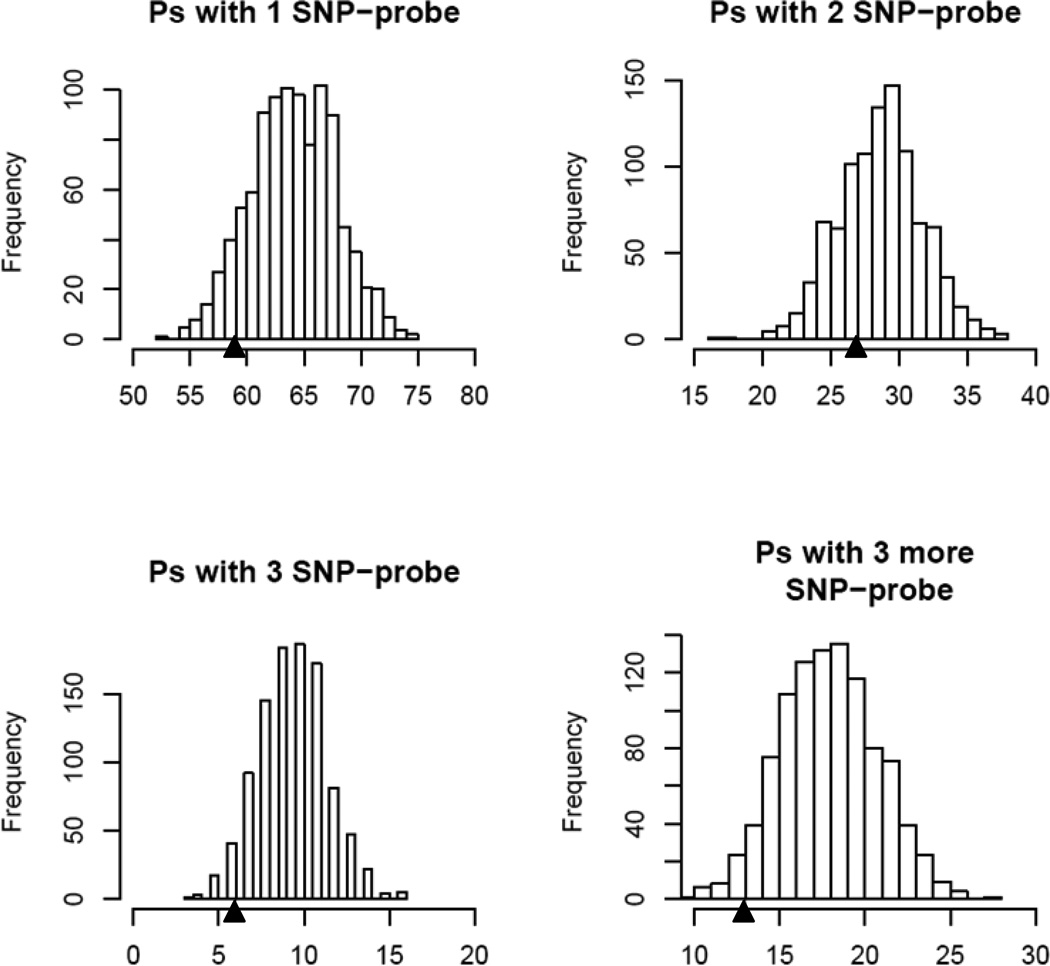
Single nucleotide polymorphisms (SNPs) between microarray probes and RNA targets can affect the performance of expression array by weakening the hybridization. In this paper, we examined the effect of the SNPs on Affymetrix GeneChip probe set summaries and the expression quantitative trait loci (eQTL) mapping results in two eQTL datasets, one from mouse and one from human. We showed that removing SNP-containing probes significantly changed the probe set summaries and the more SNP-containing probes we removed the greater the change. Comparison of the eQTL mapping results between with and without SNP-containing probes showed that less than 70% of the significant eQTL peaks were concordant regardless of the significance threshold. These results indicate that SNPs do affect both probe set summaries and eQTLs (both cis and trans), thus SNP-containing probes should be filtered out to improve the performance of eQTL mapping.
Figures
Similar articles
-
AffyMAPSDetector: a software tool to characterize Affymetrix GeneChip expression arrays with respect to SNPs.BMC Bioinformatics. 2007 Jul 30;8:276. doi: 10.1186/1471-2105-8-276. BMC Bioinformatics. 2007. PMID: 17663786 Free PMC article.
-
Sequence polymorphisms cause many false cis eQTLs.PLoS One. 2007 Jul 18;2(7):e622. doi: 10.1371/journal.pone.0000622. PLoS One. 2007. PMID: 17637838 Free PMC article.
-
Large-scale East-Asian eQTL mapping reveals novel candidate genes for LD mapping and the genomic landscape of transcriptional effects of sequence variants.PLoS One. 2014 Jun 23;9(6):e100924. doi: 10.1371/journal.pone.0100924. eCollection 2014. PLoS One. 2014. PMID: 24956270 Free PMC article.
-
eQTL analysis in mice and rats.Methods Mol Biol. 2009;573:285-309. doi: 10.1007/978-1-60761-247-6_16. Methods Mol Biol. 2009. PMID: 19763934 Review.
-
Quantitative trait loci for IQ and other complex traits: single-nucleotide polymorphism genotyping using pooled DNA and microarrays.Genes Brain Behav. 2006;5 Suppl 1:32-7. doi: 10.1111/j.1601-183X.2006.00192.x. Genes Brain Behav. 2006. PMID: 16417615 Review.
Cited by
-
Genomic-Analysis-Oriented Drug Repurposing in the Search for Novel Antidepressants.Biomedicines. 2022 Aug 11;10(8):1947. doi: 10.3390/biomedicines10081947. Biomedicines. 2022. PMID: 36009493 Free PMC article.
-
Genetic dissection of the Drosophila melanogaster female head transcriptome reveals widespread allelic heterogeneity.PLoS Genet. 2014 May 8;10(5):e1004322. doi: 10.1371/journal.pgen.1004322. eCollection 2014 May. PLoS Genet. 2014. PMID: 24810915 Free PMC article.
-
Dissecting Brain Networks Underlying Alcohol Binge Drinking Using a Systems Genomics Approach.Mol Neurobiol. 2019 Apr;56(4):2791-2810. doi: 10.1007/s12035-018-1252-0. Epub 2018 Jul 30. Mol Neurobiol. 2019. PMID: 30062672 Free PMC article.
-
Modeling expression quantitative trait loci in data combining ethnic populations.BMC Bioinformatics. 2010 Feb 27;11:111. doi: 10.1186/1471-2105-11-111. BMC Bioinformatics. 2010. PMID: 20187971 Free PMC article.
-
Variation in Drosophila melanogaster central metabolic genes appears driven by natural selection both within and between populations.Proc Biol Sci. 2015 Feb 7;282(1800):20142688. doi: 10.1098/rspb.2014.2688. Proc Biol Sci. 2015. PMID: 25520361 Free PMC article.
References
-
- Sachidanandam R, Weissman D, Schmidt SC, Kakol JM, Stein LD, Marth G, et al. A map of human genome sequence variation containing 1.42 million single nucleotide polymorphisms. Nature. 2001;409:928–933. - PubMed
-
- Yamashita S, Nomoto T, Ohta T, Ohki M, Sugimura T, Ushijima T. Differential expression of genes related to levels of mucosal cell proliferation among multiple rat strains by using oligonucleotide microarrays. Mamm Genome. 2003;14:845–852. - PubMed
-
- Affymetix. Statistical Algorithms Description Document. Technical Report. 2002
-
- Affymetrix. Single Nuceotide Polymorphism Marker Selection and Assay Validation. 2007 Affymetrix. Technical Notes. Internet Communication.
Publication types
MeSH terms
Substances
Grants and funding
LinkOut - more resources
Full Text Sources
