. 2009 Feb 26;61(4):527-40.
doi: 10.1016/j.neuron.2009.01.010.

Dscam mediates remodeling of glutamate receptors in Aplysia during de novo and learning-related synapse formation

Affiliations

Dscam mediates remodeling of glutamate receptors in Aplysia during de novo and learning-related synapse formation

Hsiu-Ling Li et al. Neuron. .

Abstract

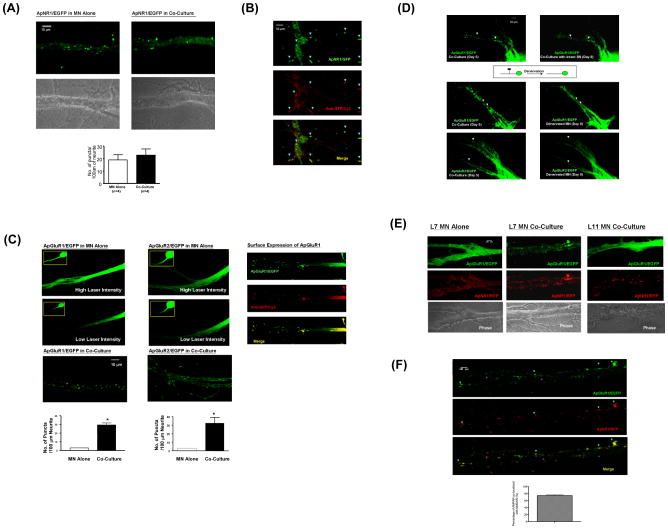
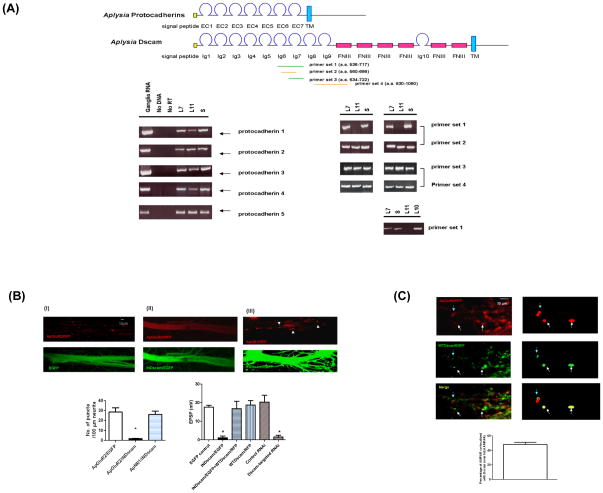
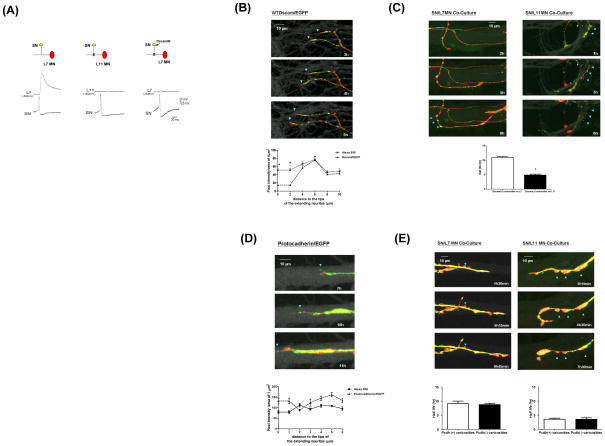
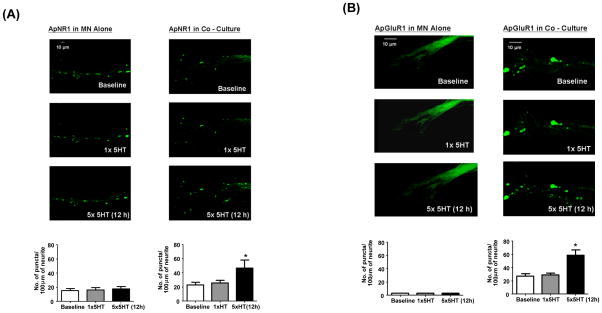
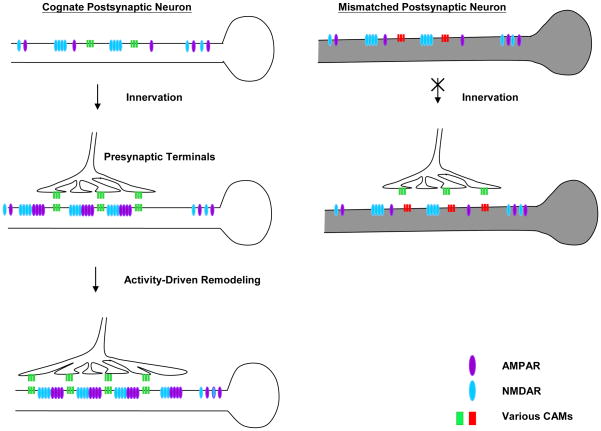
Transsynaptic interactions between neurons are essential during both developmental and learning-related synaptic growth. We have used Aplysia neuronal cultures to examine the contribution of transsynaptic signals in both types of synapse formation. We find that during de novo synaptogenesis, specific presynaptic innervation is required for the clustering of postsynaptic AMPA-like but not NMDA-like receptors. We further find that the cell adhesion molecule Dscam is involved in these transsynaptic interactions. Inhibition of Dscam either pre- or postsynaptically abolishes the emergence of synaptic transmission and the clustering of AMPA-like receptors. Remodeling of both AMPA-like and NMDA-like receptors also occurs during learning-related synapse formation and again requires the reactivation of Dscam-mediated transsynaptic interactions. Taken together, these findings suggest that learning-induced synapse formation recapitulates, at least in part, aspects of the mechanisms that govern de novo synaptogenesis.


Figures

Figure 1
Figure 1
Clustering of AMPA-like but not NMDA-like receptor requires presynaptic inputs during de novo synapse formation. (A) ApNR1/EGFP clusters distribute along the entire neuritic arbors of postsynaptic L7 MN alone and co-cultured with SN (left and right panels, respectively). Unless otherwise specified, the quantification of the numbers of glutamate receptor clusters in this study was performed using an algorithm described in Materials and Methods. The results are expressed as the mean numbers of puncta per 100 μm of neurite ± standard error (19±4.203 and 22.75±4.958 puncta in L7 MN alone and co-cultured with SN, respectively. There is no statistical difference between these two groups by a two-sample t test, p>0.05, n=4). (B) NMDA-like receptors are targeted to the membrane even in the absence of presynaptic neurons. Isolated L7 MN that express ApNR1/EGFP were fixed under non-permeabilized condition. Surface expression of ApNR1/EGFP was detected using anti-GFP antibody followed by Cy3-conjugated secondary antibody (arrowheads). (C) ApGluR1/EGFP or ApGluR2/EGFP was expressed into L7 MN in the absence or presence of SN (left and right columns, respectively). Both ApGluR1 and ApGluR2 show diffuse and gradient distribution along the processes of solitary MN using both high and low laser intensity (5 mW and 1.5 mW respectively) at the same sample (top and middle panels). The images acquired under lower magnification are shown in insets. By contrast, both subunits of AMPA-like receptors form distinctive puntate structures along the neurites of L7 MN when innervated by SN (bottom panels). Surface expression of ApGluR1 was detected using anti-GFP antibody followed by Cy3-conjugated secondary antibody (right panels). In L7 MN alone, the number of puncta per 100 μm of neurites is 3±0.2 for both ApGluR1, n=6 and ApGluR2, n=7, whereas they are 29.41±2.324, n=10, for ApGluR1 and 32.38±6.628, n=7, for ApGluR2 in L7 MN co-cultured with SN, p<0.001, by a two-sample t test. (D) presynaptic innervation is required for the maintenance of the clustering of glutamate receptors. ApGluR1/EGFP or ApGluR2/EGFP was expressed in L7 MN co-cultured with SN after 1 day in vitro. We allowed the cells to re-establish synapses for 5 days before killing SN (middle and bottom left panels). Clusters of ApGluR1 and ApGluR2 disperse over time and prominent changes in the clustering patterns could be clearly observed at 4 days after denervation (middle and bottom right panels, n=3), whereas there was very little change in the distribution of ApGluR2 clusters in the MN innervated by intact SN at the same time point (top panels). (E) Specific interaction between pre- and postsynaptic neurons is required for the clustering of AMPA receptors. ApNR1/RFP and ApGluR1/EGFP were co-expressed in isolated L7 MN (left panels), L7 MN co-cultured with SN (middle panels) or L11 MN co-cultured with SN (right panels). ApNR1/RFP cluster in the processes of MN under all culture configurations, whereas ApGluR1/EGFP cluster only in MN that is properly innervated by presynaptic SN (middle panels). ApGLuR1/EGFP fails to cluster in either solitary L7 MN (top left panels) or mismatched L11 MN co-cultured with presynaptic SN (top right panels). The phase images of each culture condition are shown at the bottom panels. Please note that it is very common that the size of Aplysia neurons varies among individual cultures,. However, this does not affect the major conclusions of the experiments. For full-size images of this experiment, see Supplemental Images. (F) The enlarged images of the co-localization pattern of ApGluR1/EGFP and ApNR1/RFP receptors of Figure 1E (SN-L7 MN co-culture, middle panel). To clearly demonstrate the co-localized and non-colocalized puncta (blue and pink arrowheads), we presented the results acquired at lower laser intensity compared to that in Figure 1E. These data were quantified and presented as the percentage of AMPA receptors co-localized with NMDA receptors (74.34±2.146%, n=4).
Figure 2
Figure 2
ApDscam is commonly expressed in synaptically-related neurons. (A) The structural organization of Aplysia protocadherins and Dscam is shown in the diagram. Single cell RT/PCR showed that the pleural SN, L7 and L11 MN express comparable levels of five different protocadherins tested compared to total RNA isolated from Aplysia ganglia. There is no detectable signal in samples containing no cells or reverse transcriptase. The expression of ApDscam was tested using four sets of primers. The ApDscam messages in both SN and L7 MN, but not in L11 MN can be amplified by specific primer set 1 that covers Ig6 and partial Ig7 domain. However, using primer 3 that covers the entire Ig7 domain, we were able to detect comparable amounts of signal in all three cell types. Our sequencing results further suggest there is no diversity of Ig 7 domain in Aplysia. The difference of Dscam on L7 and L11 resides in the region before Ig7domain. This ApDscam is also expressed in L10 interneuron that makes both excitatory and inhibitory synapses with L7 MN (bottom row). In these experiments, primer set 2 and 4 were used as internal controls. (B) ApGluR2/RFP was co-expressed with EGFP or INDscam/EGFP in L7 MN on day 1 after being co-cultured with SN (panel I and II). Over-expression of INDscam/EGFP, but not EGFP abolishes clustering of ApGluR2/RFP. INDscam has no effect on the clustering of ApNR1/RFP (panel III), even when the expression level is higher than that required to abolish the clustering of ApGluR2/RFP (panel II). The quantification for these results is shown at the bottom left panel. The number of punta per 100 μm of neurites in ApGluR2/INDscam is statistically different from that in ApGluR2/EGFp and ApNR1/INDscam (1.75±0.25, 28.5±4.39 and 26.25±3.275, respectively. n=4 and p<0.05, by a two-sample t test). The mean EPSP in SN-MN synapses expressing EGFP alone, INDscam/EGFP alone, co-expressing INDscam/EGFP and WTDscam/RFP and expressing WTDscam/EFP alone are (mV) 17.56±0.985, 1.087±0.928, 16.73±4.018 and 18.7±2.42, respectively. The effect of INDscam/EGFP on evoked EPSP is statistically different from that in EGFP alone p<0.002, n=4 by a two-sample t test. These results are further supported by the RNAi approach. A mixture of 3 species of Dscam-targeted RNAi, but not the equivalent mixture of control RNAi, blocks the evoked SN-MN EPSP. The mean EPSP between SN-MN synapses in Dscam-targeted RNAi and control RNAi are 1.5±0.95 mV and 20.25±3.70 mV, respectively (p<0.002, n=4 by a two sample t test). (C) AMPA receptors are co-localize with WTDscam in L7 MN co-cultured with SN (arrowheads). The left panels show the confocal images and the diagrams at the right panels illustrate several examples of superimposed puncta (arrowheads). The quantitative results are presented as the percentage of AMPA receptors which are either completely or partially co-localized with WTDscam over total AMPAR ( 48.25±3.11%, n=3).
Figure 3
Figure 3
Presynaptic Dscam is required for de novo synapse formation (A) The trace results of the EPSP recorded from MN (top row). Presynaptic overexpression of the INDscam/EGFP abolishes the evoked EPSP. (B) Dynamic changes of Dscam in the actively extending neurites. WTDscam/GFP was over-expressed in SN co-cultured with L7 or L11 MN. SN and MN were filled with the whole cell markers, dextran Alexa 555 (shown in red) and 680 (shown in gray), respectively. Data presented here are the clips of a series of time-lapse video imaging (also see Supplemental Videos 1–4). The intensity of Dscam/EGFP and Alexa 555 was quantified in a blind fashion by Image J and expressed as the pixel intensity of 4 μm2. Dscam accumulates at the base, but not the leading edge of growth cones of extending neurites (left panels). The ratio of WTDscam/EGFP over Alexa 555 is 0.984, 0.882 and 0.877at 4, 6, 8 and 10 μm but decreases to 0.261 within 2 μm from the tips of growth cones, respectively (p<0.05, n=6 by a two-sample t test). The actual pixel intensity of each data point is in the Supplemental Figure S5. (C) SN varicosities contacting L7 MN are more stable and associated with the retention of Dscam compared to those on L11 MN (blue arrowheads, the average half life is 10.858h±0.404 and 4.857h±0.34, respectively. p,0.001, n=7 by a two sample t test). (D) Protocadherin/EGFP (Pcdh/EGFP) was over-expressed in SN co-cultured with L7 or L11 MN (also see Supplemental Videos 5–8). In contrast to Dscam, protocadherin often accumulates at the leading edge of growing axons (The ratio of Pcdh/EGFP over Alexa 555 is 1.657±0.058 and 0.7967±0.024 at 1 and 2 μm from the tips of growing axons, p<0.05, n=5 by two sample t tests and the ratio at 3, 4, 5, and 6μm are 1.317±0.136, 1.32±0.085, 1.49± 0.013 and 1.412±0.044). Images shown here are enlarged for the clarity of the tips of growing axons. (E) The presence of Pcdh/EGFP is not directly associated with the stability of presynaptic varicosities. Some of the stable varicosities in SN-L7 co-culture do not contain significant levels of Pcdh/EGFP (arrowheads, left panels). Some of the unstable varicosities in SN-L11 co-culture contain significant levels of Pcdh/EGFP (arrowheads, right panels). The quantification results are shown at bottom panels. The average half life of Pcdh(+) and Pcdh(−) SN varicosities on L7 MN is 9.1 h±0.87 and 8.75 h±0.48, respectively. The average half life of SN varicosities on L11 MN is 3.575 h±0.36 and 3.525 h±0.53.
Figure 4
Figure 4
LTF but not STF is associated with the remodeling of glutamate receptors. ApNR1/EGFP or ApGluR1/EGFP was expressed in L7 MN alone or co-cultured with SN after 1 day in vitro (4A and 4B, respectively). Cells were stimulated with 5-HT on day 5 (top panels). Induction of STF does not lead to any significant redistribution of ApNR1 and ApGluR1 in L7 MN alone (4A and 4B, middle left panels) or co-cultured with SN (4A and 4B, middle right panels). By contrast, induction of LTF is accompanied by remodeling of ApNR1 and ApGluR1 in L7 MN co-cultured with presynaptic SN (4A and 4B, bottom right panels) but not in L7 MN alone (4A and 4B, bottom left panels). ApGluR1 exhibits a diffuse but gradient distribution in L7 MN alone (4B, left panels, images were acquired using laser power of 1.5 mW). For ApNR1 in L7 MN alone, the numbers of puncta per 100 μm of neurite are 15.33±2.906 before treatment, 16.00±3.215 at 10 min after 1xHT and 17.67±3.18 at 12h after 5×5-HT, n=3. There is no statistical difference between these groups, p>0.05 by a one-sample t test. For ApNR1 in L7 MN co-cultured with SN, the number of puncta/100 μm are 22.80±3.839 and 25.40±4.00 before and at 10 min after 1×5-HT (p>0.05). However, the value at 12 h after 5×5-HT increases to 47.40±8.733, n=3 (p<0.05). For ApGluR1, the number of puncta/100 μm are 27.00±3.60 before treatment and remains 28.67±3.18 at 10 minutes after 1xHT (p>0.05, by a one-sample t test) and increases to 61.67±7.625 at 12h after 5×5-HT, n=3 (p<0.05).
Figure 5
Figure 5
LTF-associated formation of new SN to MN synapses. (A) The phase Image of SN and L7 MN co-culture. DNAs encoding ApSynapsin/RFP and ApGluR1/EGFP were injected into SN and L7 MN, respectively. (B and C) The distribution of ApSynapsin/RFP and ApGluR1/RGFP at baseline and 24h after 5-HT treatment is shown at the left and right panels, respectively. The insets in each panels are enlarged and shown right below the corresponding images. There is a high percentage of non-colocalized signals outside of the major processes of L7 MN (pink arrowheads), whereas the signals along the initial segment of L7 MN (insets) have higher percentage of co-localization (blue arrowheads).. The percentage of ApGluR-1 puncta co-localized with ApSynapsin are 29.50±8.977% before treatment and 61.67±7.265% at 24 h after 5×5-HT, n=5, p<0.05, by a one-sample t test). The cell bodies, but not the processes of Aplysia neurons are prone to emit autofluorescence. In this experiment, the autofluorescence is detectable with EGFP, but not RFP signals. For full size results, see Supplemental Images.
Figure 6
Figure 6
Dscam is involved in LTF-associated remodeling of SN to MN synapses. (A) ApGluR2/RFP was expressed in L7 MN on day 1 after co-cultured with SN. INDscam/EGFP or EGFP was then expressed in the same L7 MN on day 4. The distribution of ApGluR2/RFP and the evoked EPSP were then monitored at 10 min or 12 h after treatment with 1 pulse or 5 pulses of 5-HT, respectively. The effects of INDscam on the expression of STF and LTF are summarized in Table 2. Overexpression of INDscam postsynaptically or INDscam presynaptically abolishes 5-HT-induced LTF compared to EGFP alone group (LTF(II)(1,3,5), p<0.01, n=4, by a two- sample t test), but has no effect on STF (STF(II) (1–3), p>0.05, n=4 by a two-sample t test). Moreover, in the absence of 5-HT, INDscam and EGFP have no significant effect on the EPSP during the same time period (LTF(I)(2,3) in Table 2). The effect of INDscam on the induction of LTF can be rescued by co-expression with WTDscam/RFP both pre- and postsynaptically (LTF(II)(4,6) in Table 2). Over-expression of WTDscam/RFP alone has no effect on the expression of LTF (LTF(II)(2) in Table 2). Moreover, knocking down the expression levels of presynaptic or postsynaptic Dscam blocks LTF but not STF (LTF(II)(7–10) and STF(II)(4–6) in Table 2). The (%) change in EPSPs for Dscam RNAi group in the induction of LTF is statistically different from control RNAi, p<0.0001, n=4 by a two sample t test. However, in the absence of 5-HT, there is no significant change in the EPSP in either groups during the same time period (LTF(I)(4,5) in Table 2). (B) Induction of LTF evokes two types of remodeling in SN. Left panels illustrate the formation of new varicosities and consequent enrichment of Dscam (the ratio of the pixel intensity of Dscam/EGFP over Alexa 555 increases from 0.312 at baseline to 0.568 at 12h after induction of LTF, p<0.05, n=4 by a one-sample t test). The actual pixel intensity of each data point is in the Supplemental Figure S5. Right panels show axonal sprouting resumes after dissolution of Dscam aggregates at the neuritic terminals (the ratio of the pixel intensity of Dscam/EGFP over Alexa 555 decreases from 0.922 at baseline to 0.50 at 12h after induction of LTF, p<0.05, n=6 by a one-sample t test.) Induction of STF does not trigger any discernible redistribution of Dscam. (D) Induction of LTF triggers re-targeting of Pcdh/EGFP to the tips of the growing axons (the ratio of the pixel intensity of Protocadherin/EGFP over Alexa 555 at 1μm from the tips of the growing axons is 1.022±0.07 (0h), 0.987±0.09 (2h), 1.192±0.143 (4h), 1.57±0.0 (6h), 1.393±0.052 (8h), 1.428±0.06 (10h) and 1.94±0.13 (12h)). The results from 6 to 12 h after stimulation is significantly different from baseline, p<0.05, n=4 by a one-sample t test. However, induction of STF does not evoke any discernible changes in the distribution of Pcdh/EGFP (right panel). The ratio of the pixel intensity of Pcdh/EGFP over Alexa 555 is 1.239±0.18 (0h), 1.268±0.172 (3h), 1.141±0.137 (6h), 1.155±0.19 (9h) and 1.19±0.24 (12h).
Figure 7
Figure 7
Possible mechanisms of Dscam-mediated synapse formation. Prior to presynaptic innervation, NMDA receptors cluster randomly along the postsynaptic surface. Upon presynaptic innveration, the trans-synaptic signaling mediated by various cell adhesion molecules (e.g. Dscam) promotes the subsequent organization of postsynaptic AMPA receptors and the stabilization of presynaptic varicosities. The induction of LTF can reutilize aspects of the developmental program. In response to the induction of LTF, postsynaptic Dscam regulates the remodeling of AMPA receptors whereas an enrichment of presynaptic Dscam stabilizes newly formed varicosities to promote the formation of new functional synaptic connections.

Similar articles

Cited by

References

    1. Agarwala KL, Ganesh S, Amano K, Suzuki T, Yamakawa K. DSCAM, a highly conserved gene in mammals, expressed in differentiating mouse brain. Biochem Biophys Res Commun. 2001;281:697–705. - PubMed
    1. Bailey CH, Alberini C, Ghirardi M, Kandel ER. Molecular and structural changes underlying long-term memory storage in Aplysia. Adv Second Messenger Phosphoprotein Res. 1994;29:529–544. - PubMed
    1. Bailey CH, Kandel ER. Structural changes accompanying memory storage. Annu Rev Physiol. 1993;55:397–426. - PubMed
    1. Barlow GM, Micales B, Chen XN, Lyons GE, Korenberg JR. Mammalian DSCAMs: roles in the development of the spinal cord, cortex, and cerebellum? Biochem Biophys Res Commun. 2002;293:881–891. - PubMed
    1. Barlow GM, Micales B, Lyons GE, Korenberg JR. Down syndrome cell adhesion molecule is conserved in mouse and highly expressed in the adult mouse brain. Cytogenet Cell Genet. 2001;94:155–162. - PubMed

Publication types

MeSH terms

LinkOut - more resources