. 2009 Feb 26;61(4):556-69.
doi: 10.1016/j.neuron.2008.12.028.

A presynaptic homeostatic signaling system composed of the Eph receptor, ephexin, Cdc42, and CaV2.1 calcium channels

Affiliations

A presynaptic homeostatic signaling system composed of the Eph receptor, ephexin, Cdc42, and CaV2.1 calcium channels

C Andrew Frank et al. Neuron. .

Abstract

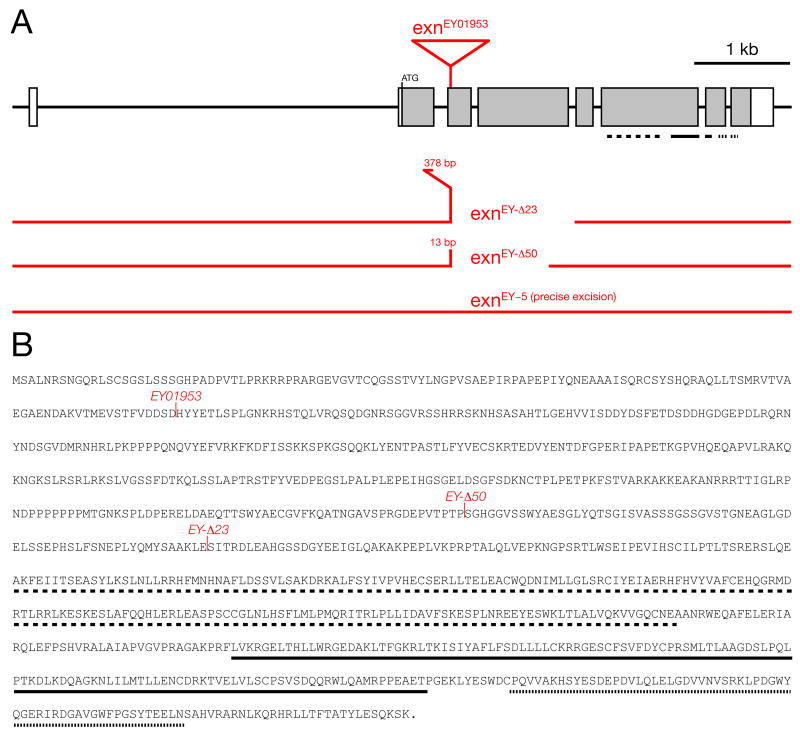
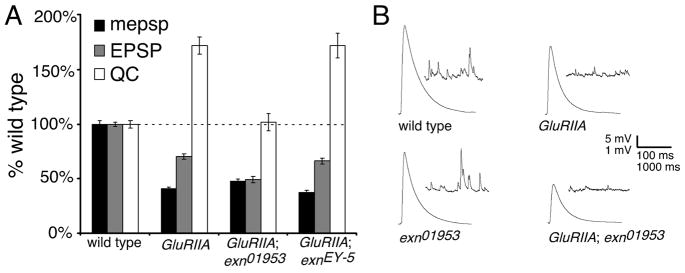
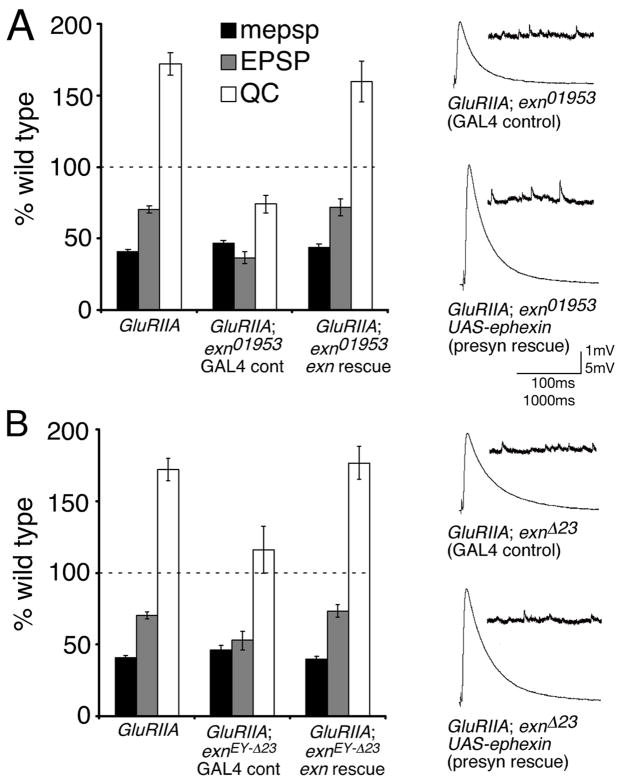
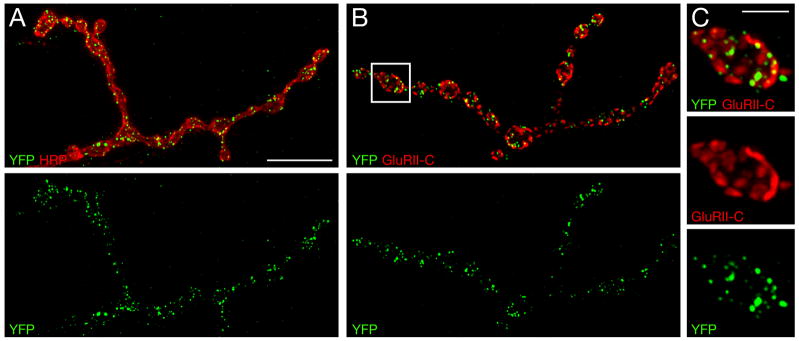
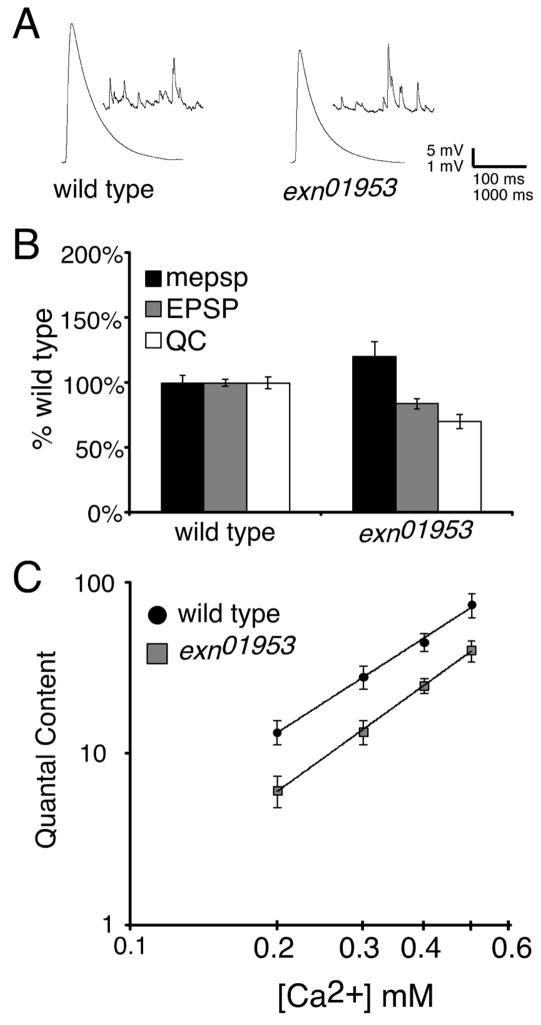
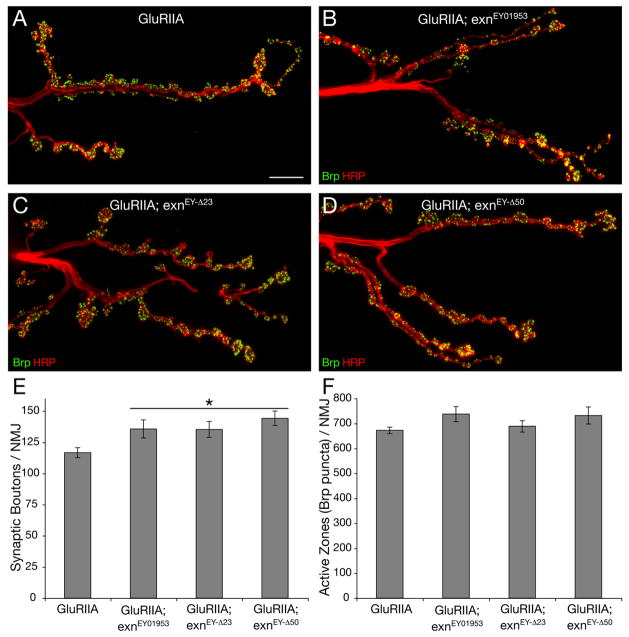
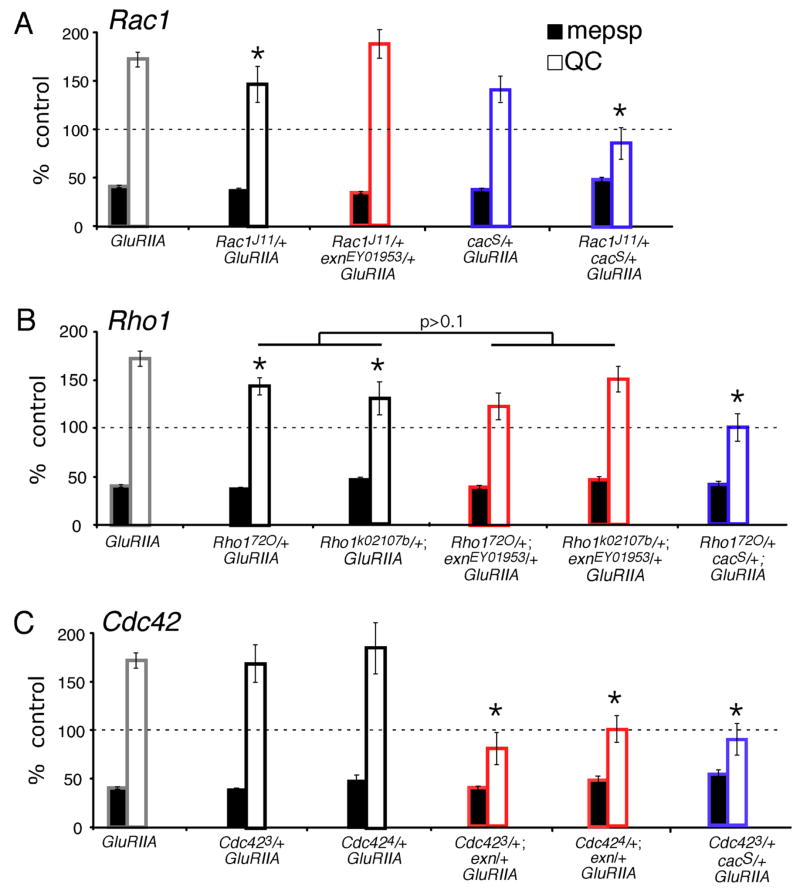
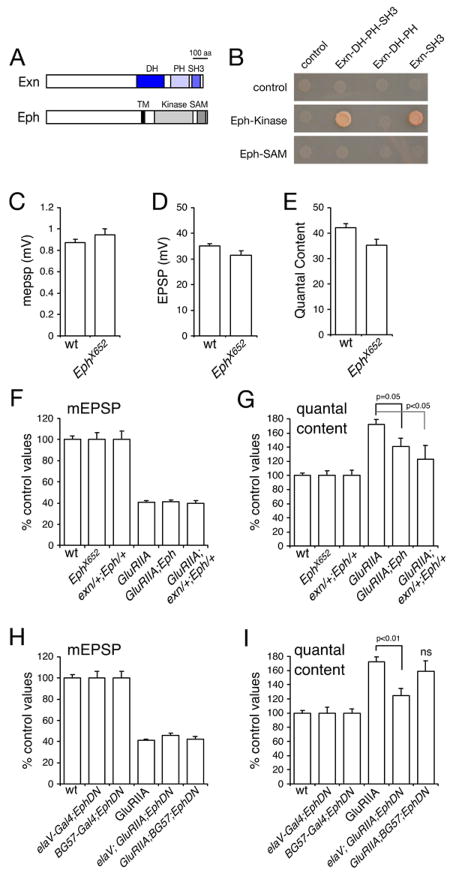
The molecular mechanisms underlying the homeostatic modulation of presynaptic neurotransmitter release remain largely unknown. In a screen, we isolated mutations in Drosophila ephexin (Rho-type guanine nucleotide exchange factor) that disrupt the homeostatic enhancement of presynaptic release following impairment of postsynaptic glutamate receptor function at the Drosophila neuromuscular junction. We show that Ephexin is sufficient presynaptically for synaptic homeostasis and localizes in puncta throughout the nerve terminal. However, ephexin mutations do not alter other aspects of neuromuscular development, including morphology or active zone number. We then show that, during synaptic homeostasis, Ephexin functions primarily with Cdc42 in a signaling system that converges upon the presynaptic CaV2.1 calcium channel. Finally, we show that Ephexin binds the Drosophila Eph receptor (Eph) and Eph mutants disrupt synaptic homeostasis. Based on these data, we propose that Ephexin/Cdc42 couples synaptic Eph signaling to the modulation of presynaptic CaV2.1 channels during the homeostatic enhancement of presynaptic release.


Figures

Figure 1
Figure 1. Organization and mutation of the Drosophila exn locus
A) Genomic overview of the exn gene. The insertion site of the P-element exnEY01953 and the extent of the deletions in the excision alleles exnEY-Δ23 and exnEY-Δ50 are indicated. The allele exnEY-5 is a precise excision of the exnEY1953 P-element insertion. B) Primary amino acid sequence of the Exn protein. exn encodes a 1051 amino acid long protein that contains a RhoGEF domain (dashed line), a PH domain (solid line) and an SH3 domain (dotted line). Domain location is also indicated in (A). The insertion of exnEY01953 and the distal break points of the exnEY-Δ23 and exnEY-Δ50 deletions are indicated.
Figure 2
Figure 2. Impaired synaptic homeostasis at the exn mutant NMJ
A) Average values for mepsp (black), EPSP (gray), and quantal content (white) relative to wild-type control. The GluRIIASP16 mutation causes a decrease in quantal size (mepsp). Decreased mepsp amplitude is partially offset by a homeostatic increase in presynaptic release (QC) (p<0.001; Student’s T-test). The GluRIIASP16; exnEY01953 double mutant NMJs show a decrease in mepsp amplitude without a corresponding increase in QC (p>0.2 compared to wild type). A genotype composed of the precise excision allele (EY-5) and GluRIIASP16 shows a robust homeostatic increase in QC (p<0.001) similar to GluRIIASP16 alone (p>0.9 compared to GluRIIASP16 alone). We also note a significant increase in mepsp amplitude comparing GluRIIASP16; exnEY01953 to the revertant GluRIIASP16; exnEY-5 (p<0.05). B) Representative electrophysiological traces as indicated. Statistically significant differences are calculated according to an unpaired, two-tailed Student’s T-test. Data are presented as average values (± SEM). Data relevant to this figure are also presented in supplemental table 1.
Figure 3
Figure 3. Exn is sufficient presynaptically for synaptic homeostasis
A) Average values for mepsp (black), EPSP (gray), and quantal content (QC; white) relative to wild-type control. Values are presented for GluRIIASP16 alone, GluRIIASP16; exnEY01953 double mutants bearing a UAS-YFP-exn construct driven by the presynaptic elav-GAL4 driver (exn rescue), or for sibling-matched controls with no driver (GAL4 control). Expression of UAS-YFP-exn significantly restores the homeostatic increase in release (p<0.001 compared to sibling matched GAL4 control). Representative traces are shown at right. B) Values presented as in (A). Experiments are performed as in (A) except that the exnEY-Δ23 mutation is used. Representative traces are shown at right. Data are presented as average values (± SEM). Data relevant to this figure are presented in supplemental table 1.
Figure 4
Figure 4. YFP-Exn distribution within the presynaptic nerve terminal
A–C) Overexpression of YFP-exn in motoneurons. A) NMJ co-stained for YFP-Exn (green) and presynaptic membranes (HRP, red). YFP-Exn is present in discrete puncta that are distributed throughout the presynaptic nerve terminal. B and C) The NMJ co-stained for YFP (green) and postsynaptic glutamate receptors (GluRII-C, red). C) Higher magnification of the boxed area in (B) shows accumulation of YFP-Exn opposite postsynaptic GluRII-C clusters. Scale bar in (A)–(B) 10 μm. Scale bar in (C) 2.5 μm.
Figure 5
Figure 5. Impaired presynaptic release without a change in release cooperativity in exnEY01953 mutants
A) Representative electrophysiological traces of wild-type and exnEY01953 NMJs. B) Average values for mepsp (black), EPSP (gray), and quantal content (white) relative to wild-type control. exnEY01953 mutant NMJs display a small, yet significant deficit in neurotransmission (p<0.05). C) Quantal content was quantified for wild type (black) and exnEY01953 (gray) over the range of extracellular calcium concentrations indicated. Statistically significant differences are indicated according to an unpaired, two-tailed Student’s T-test. Data are presented as average values (± SEM).
Figure 6
Figure 6. Normal active zone number at exn mutant NMJ
A–D) Partial view of muscle 6/7 NMJs in segment A2 co-stained for the presynaptic active zone protein Brp (green) and the presynaptic membrane marker HRP (red) for the genotypes indicated. Gross NMJ morphology is normal in each mutant. E) Quantification of the number of synaptic boutons at muscles 6/7 in segment A2. All exn mutations lead to a slight but significant (p<0.05) increase in bouton number compared to GluRIIA mutations alone (n ≥ 8). F) Quantification of the number of presynaptic active zones marked by Brp staining of muscle 6/7 NMJs in segment A2 (see text). There is no significant difference in the total number of Brp-positive active zones in exn mutants compared to the GluRIIA control background (n ≥ 9). Scale bar in (A)–(D) 10 μm. Statistically significant differences are indicated according to an unpaired, two-tailed Student’s T-test. Data are presented as average values (± SEM).
Figure 7
Figure 7. Genetic interaction between exn and presynaptic calcium channels encoded by cac (CaV2.1)
A) mepsp (black), EPSP (gray), and quantal content (QC; white) are plotted relative to genetic controls lacking the GluRIIA mutation. cacS/+; GluRIIASP16 and exnEY01953/+; GluRIIASP16 NMJs display robust homeostatic compensation that is slightly suppressed relative to control (p<0.05 for cacS/+; GluRIIASP16). By contrast, when a double heterozygous mutant combination is assayed in the GluRIIA mutant background (cacS/+; GluRIIASP16; exnEY01953/+) or (cacS/+; GluRIIASP16; exnEY-Δ23/+) the NMJs show no homeostatic increase in quantal content compared to control. B, C) Presynaptic expression of GFP-cac restores homeostatic compensation to the GluRIIA; exn double mutant. B) Average values as in (A). For the rescue experiment, values are presented for GluRIIASP16; exnEY01953 double mutants bearing a UAS-GFP-cac construct driven by the presynaptic elav-GAL4 driver (presynaptic Cac), or for sibling-matched controls with no driver (control). In the absence of elav-GAL4, no rescue is observed (control). In the presence of elav-GAL4, a significant homeostatic increase in QC is observed (p<0.01 compared to sibling matched controls). The level of homeostatic compensation does not reach GluRIIA alone (p<0.05). C) Representative electrophysiological traces as indicated. Statistically significant differences are indicated according to an unpaired, two-tailed Student’s T-test. Data are presented as average values (± SEM). Data for (A) are presented in Supplemental Table 3. Data for (B) are presented in Supplemental Table 1.
Figure 8
Figure 8. Rho-GTPases participate in the mechanism of synaptic homeostasis
Quantification for mepsp (black) and quantal content (QC; white) are plotted relative to control values in the absence of the GluRIIA mutation (100%). A) A heterozygous Rac1J11/+ mutant (black) has a slight, but significant (p<0.05) decrease in synaptic homeostasis when compared to GluRIIA alone (black). This effect is not enhanced by a heterozygous exn mutation (Rac/+ with exn/+ in the GluRIIA mutant background; red). The heterozygous cacS mutation does not abolish homeostatic increase in QC in the GluRIIA mutant (blue). However, the double heterozygous cacS/+ Rac1J11/+ animals show a block of homeostatic compensation in the GluRIIA mutant background (blue, right). B) Heterozygous Rho1/+ mutations (black) display a partial reduction in synaptic homeostasis (*; p<0.05). This suppression of synaptic homeostasis is not significantly enhanced by removing one copy of exn (red; p>0.1). Synaptic homeostasis is completely blocked in double heterozygous cacS/+; Rho1/+ animals in the GluRIIA mutant background (blue; p<0.001 compared to GluRIIA alone). C) Heterozygous Cdc42/+ animals display a normal homeostatic increase in QC (black; p>0.9 compared to GluRIIA). Homeostatic compensation is eliminated when the double heterozygous mutant combination of Cdc42 and exn (red) are placed in the GluRIIA mutant background (p<0.001 compared to GluRIIA) and when the double heterozygous combination of Cdc42/+ with cacS/+ is placed in the GluRIIA mutant background (blue; p<0.001 compared to GluRIIA). Statistically significant differences are indicated according to an unpaired, two-tailed Student’s T-test. Data are presented as average values (± SEM). Data relevant to this figure are presented in supplemental table 2.
Figure 9
Figure 9. An Eph receptor mutation disrupts synaptic homeostasis
A) Diagrams of Drosophila Exn and Eph are shown at left. B) Data from a yeast two-hybrid system demonstrating an interaction between the Eph receptor kinase domain with constructs encoding either the DH-PH and SH3 domains of Ephexin or just the two single domains. C–E) Quantification of mepsp amplitude (C), EPSP amplitude (D) and quantal content (E) comparing wild type and the Ephx652 mutant. A significant difference (p<0.05) is found comparing EPSP amplitudes and comparing quantal contents. F) Quantification of mEPSP amplitudes for the indicated genotypes. Values are presented as normalized to values for each control genotype. Control genotypes (wt, EphX652, exn/+; Eph/+) are normalized to themselves (100%). Experimental genotypes are normalized to the appropriate control (GluRIIA is normalized to wt. GluRIIA; Eph is normalized to Eph. GluRIIA; exn/+; Eph/+ is normalized to exn/+; Eph/+). This normalization procedure takes into account any baseline transmission defect in the control genotype. All genotypes use EphX652 though this notation is shortened in some columns for display purposes. G) Quantification of quantal content normalized to control genotypes as in (F). Statistically significant differences are indicated. H) Quantification of mEPSP amplitudes for the indicated genotypes. Data are normalized as in (F). For display purposes elaV-GAL4 is shortened to elaV in column 4 and BG57-GAL4 is shortened to BG57 in column 5. (I) Quantification of quantal content for the indicated genotypes (notation as in H). Data are normalized as in (F). Statistically significant differences are indicated according to an unpaired, two-tailed Student’s T-test. Data are presented as average values (± SEM). Data relevant to this figure are presented in supplemental table 1.

References

    1. Aberle H, Haghighi AP, Fetter RD, McCabe BD, Magalhaes TR, Goodman CS. wishful thinking encodes a BMP type II receptor that regulates synaptic growth in Drosophila. Neuron. 2002;33:545–558. - PubMed
    1. Bellen HJ, Levis RW, Liao G, He Y, Carlson JW, Tsang G, Evans-Holm M, Hiesinger PR, Schulze KL, Rubin GM, et al. The BDGP gene disruption project: single transposon insertions associated with 40% of Drosophila genes. Genetics. 2004;167:761–781. - PMC - PubMed
    1. Boyle M, Nighorn A, Thomas JB. Drosophila Eph receptor guides specific axon branches of mushroom body neurons. Development. 2006;133:1845–1854. - PMC - PubMed
    1. Budnik V, Koh YH, Guan B, Hartmann B, Hough C, Woods D, Gorczyca M. Regulation of synapse structure and function by the Drosophila tumor suppressor gene dlg. Neuron. 1996;17:627–640. - PMC - PubMed
    1. Burrone J, Murthy VN. Synaptic gain control and homeostasis. Curr Opin Neurobiol. 2003;13:560–567. - PubMed

Publication types

MeSH terms