. 2009 Mar 3;15(3):207-19.
doi: 10.1016/j.ccr.2009.01.018.

Oncogenic function of ATDC in pancreatic cancer through Wnt pathway activation and beta-catenin stabilization

Affiliations

Oncogenic function of ATDC in pancreatic cancer through Wnt pathway activation and beta-catenin stabilization

Lidong Wang et al. Cancer Cell. .

Abstract

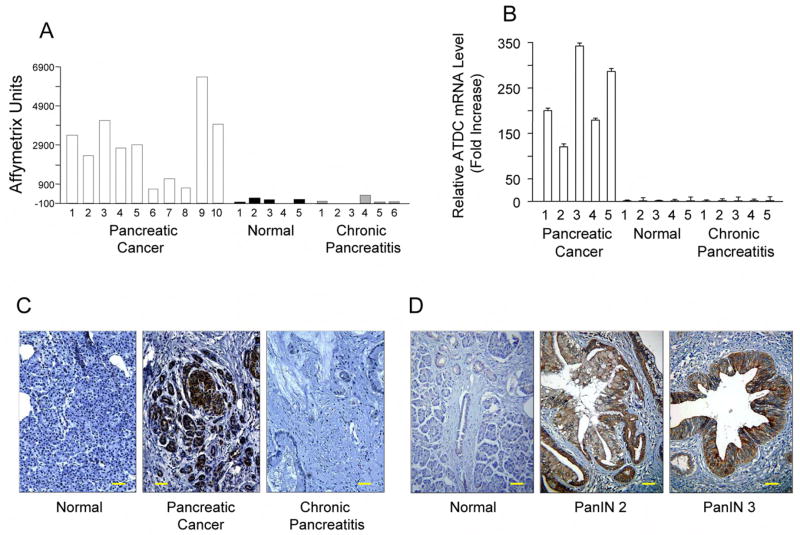
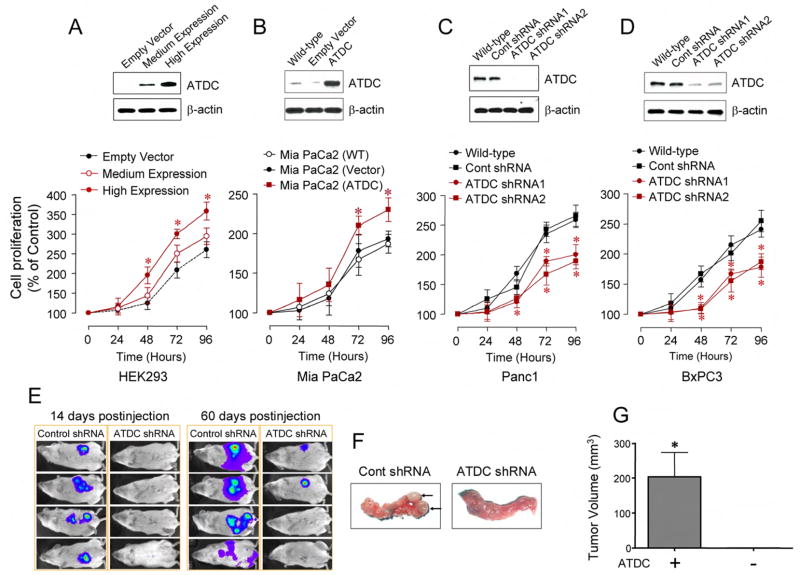
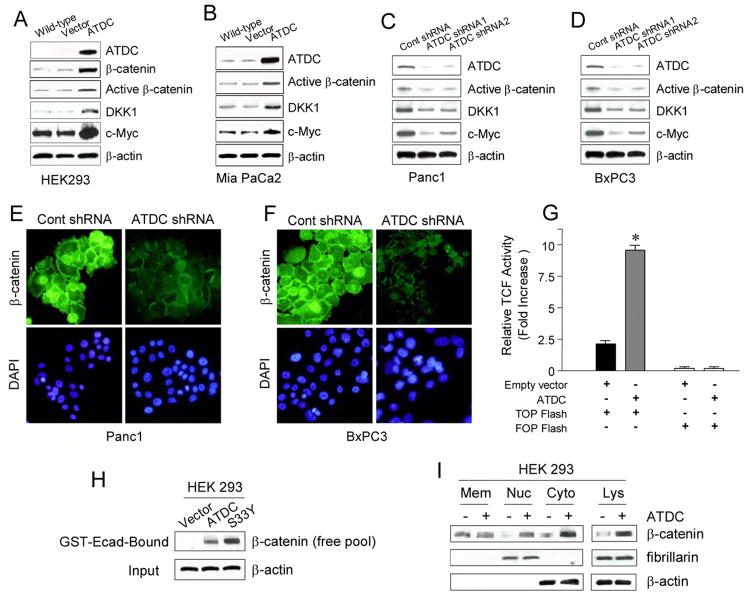
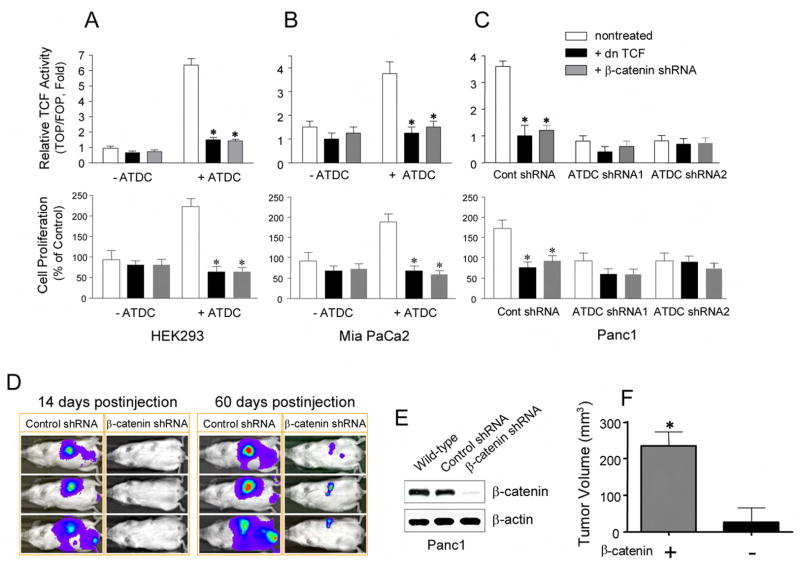
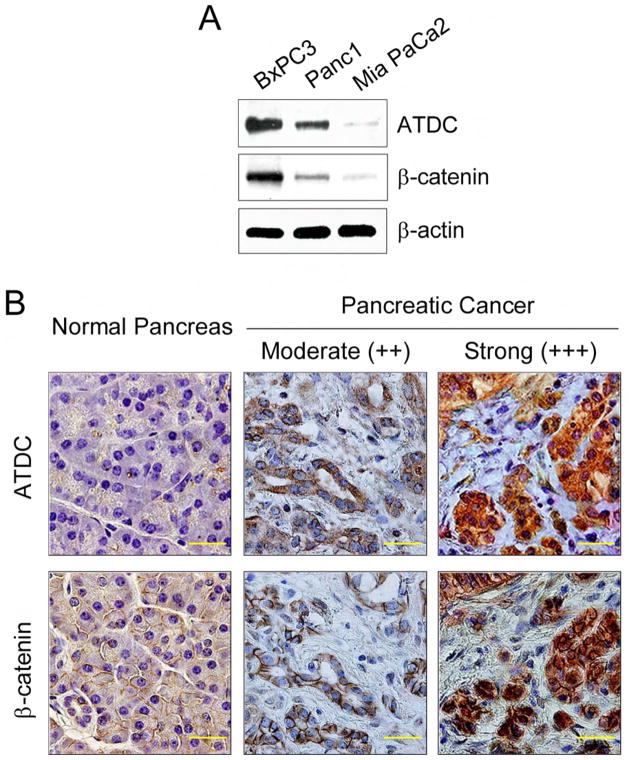
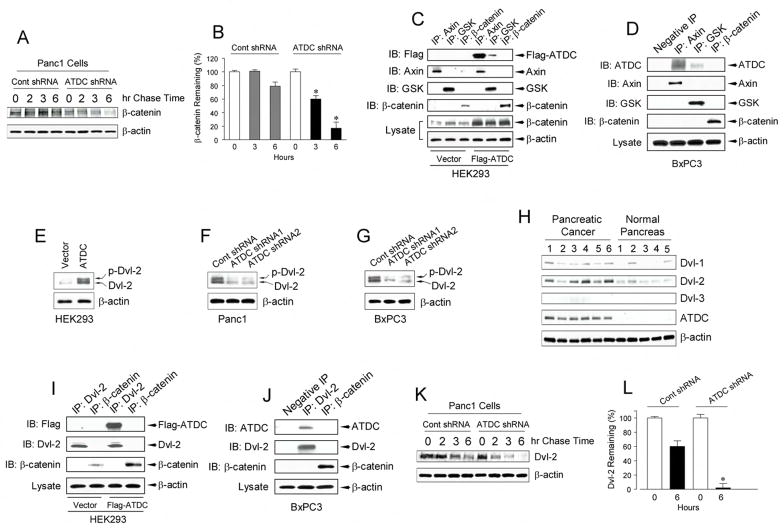
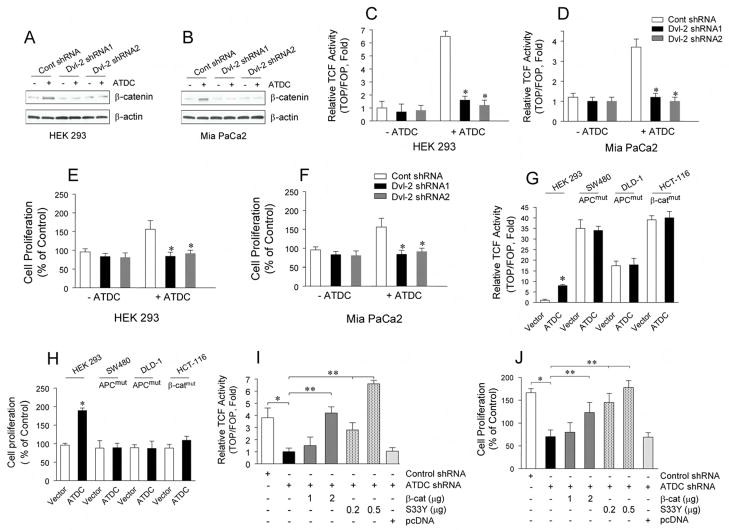
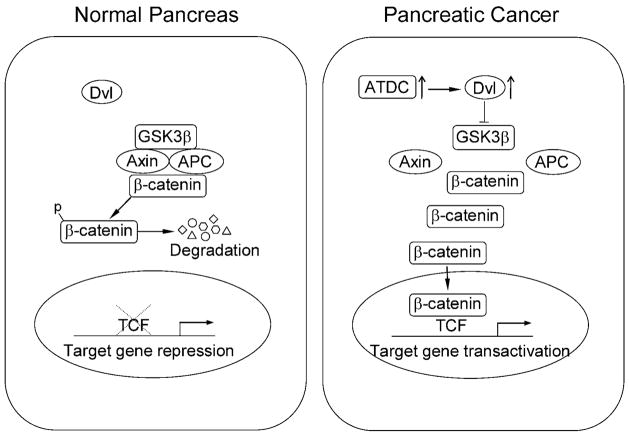
Pancreatic cancer is a deadly disease characterized by late diagnosis and resistance to therapy. Much progress has been made in defining gene defects in pancreatic cancer, but a full accounting of its molecular pathogenesis remains to be provided. Here, we show that expression of the ataxia-telangiectasia group D complementing gene (ATDC), also called TRIM29, is elevated in most invasive pancreatic cancers and pancreatic cancer precursor lesions. ATDC promoted cancer cell proliferation in vitro and enhanced tumor growth and metastasis in vivo. ATDC expression correlated with elevated beta-catenin levels in pancreatic cancer, and beta-catenin function was required for ATDC's oncogenic effects. ATDC was found to stabilize beta-catenin via ATDC-induced effects on the Disheveled-2 protein, a negative regulator of glycogen synthase kinase 3beta in the Wnt/beta-catenin signaling pathway.


Figures

Figure 1
Figure 1. ATDC is highly expressed in human pancreatic cancer
(A) cDNA microarray analysis (Logsdon et al., 2003) was done using HuGeneFL Arrays containing 7129 probe sets (Affymetrix, Santa Clara, CA). Microdissected samples of human pancreatic cancer (n=10, open bars), normal pancreas (n=5, black bars) and chronic pancreatitis (n=5, gray bars) were analyzed. mRNA expression levels of ATDC were expressed as Affymetrix units. (B) Validation of microarray results of ATDC mRNA levels using quantitative real time RT-PCR analysis. (C) ATDC immunostaining of representative samples of normal pancreas, pancreatic cancer, and chronic pancreatitis. The scale bar indicates 100 μM. (D) Immunohistochemical examination of ATDC expression in normal pancreas or pancreatic intraepithelial neoplasias (PanIN) lesions. The scale bar indicates 100 μM.
Figure 2
Figure 2. ATDC promotes cell proliferation and pancreatic tumorigenesis
(A) Upper panel, medium or high expression of ATDC in stably transfected HEK 293 cells. Lower panel, MTS proliferation assay in ATDC-transfected HEK 293 cells (mean±SE, n=4, *p<0.05 vs empty vector-transfected cells). (B) Upper panel, ATDC expression in wild type (WT), empty vector or ATDC transfected Mia PaCa2 cells. Lower panel, MTS proliferation assay in ATDC-transfected Mia PaCa2 cells (mean±SE, n=3, *p<0.05 vs empty vector-transfected cells). (C), (D) Upper panels, ATDC expression in wild type, control shRNA, ATDC shRNA1 or 2 tranfected Panc1 (C) or BxPC3 cells (D). Lower panels, MTS proliferation assays in ATDC shRNA-transfected Panc1 and BxPC3 cells (mean±SE, n=4, *p<0.05 vs wild type cells). (E) Representative bioluminescent images of half of the animals in control or ATDC shRNA group are shown at 14 (left panels) and 60 (right panels) days after injection, depicting the extent of tumor burden. (F) Representative pictures of mouse pancreata injected with control shRNA or ATDC shRNA-transfected Panc1 cells 60 days after injection. Only 25% (2/8) of the mice injected with Panc1 cells expressing ATDC shRNA had evidence of tumor formation. (G) Average tumor volume measured in animals injected with control shRNA or ATDC shRNA-transfected Panc1 cells at 60 days post-injection (mean ± SE, n=3, *p<0.05).
Figure 3
Figure 3. ATDC upregulates β-catenin levels and TCF transcriptional activity
(A, B) Representative Western blots of wild type, empty vector, and ATDC-transfected HEK 293 (A) and MiaPaCa2 cells (B). Overexpression of ATDC results in upregulation of β-catenin, active β-catenin, and the TCF target genes DKK1 and c-Myc. β-actin was used as a loading control. (C, D) Representative Western blots of Panc1 (C) and BxPC3 (D) cells expressing control shRNA, ATDC shRNA1 or 2. Silencing of ATDC in Panc1 and BxPC3 cells decreases levels of active β-catenin, DKK1 and c-Myc. β-Actin serves as a loading control. (E, F) Photomicrographs of control shRNA and ATDC shRNA1-expressing Panc1 cells (E) and BxPC3 cells (F) immunostained with an anti-β-catenin antibody (green). Cell nuclei were counterstained with DAPI (blue). (G) TCF reporter activity was assessed by using the β-catenin responsive TOPFLASH reporter and the mutant control FOPFLASH reporter in HEK 293 cells stably transfected with empty vector or an ATDC expression vector (mean±SE, *p<0.05 vs empty vector-transfected cells). (H) The GST-E-cadherin (GST-Ecad) fusion protein detects increases in the free pool of β-catenin. HEK 293 cells expressing ATDC or S33Y β-catenin (S33Y) were harvested. Free β-catenin levels were assessed by western blotting of GST-Ecad-bound fractions of cell lysate using a specific anti-β-catenin antibody. β-actin (input) was used as a loading control. (I) Representative blots of β-catenin levels in membrane (Mem), nuclear (Nuc) and cytoplasmic (Cyto) fractions and total lysates (Lys). β-actin (cytoplasmic expression) and fibrillarin (nuclear expression) were used as loading controls.
Figure 4
Figure 4. ATDC stimulates cell proliferation and tumor growth via β-catenin/TCF activation
(A, B, C) In the upper panels, TCF reporter activity was measured using the β-catenin responsive TOPFLASH reporter and the mutant control FOPFLASH reporter. The effects of stable transfection of cells with dnTCF (black bars) and β-catenin shRNA (gray bars) on relative TCF activity are shown in HEK 293 (A) and MiaPaCa2 (B) cells (with empty or ATDC expression vector) or Panc1 cells (C) (with ATDC shRNA1 or 2 expression) (mean±SE, n=3, *p<0.05 vs control, non-treated cells). In the lower panels, the effects of stable transfection of dnTCF (black bars) and β-catenin shRNA (gray bars) on cell proliferation are shown in HEK 293 (A) and MiaPaCa2 (B) cells (with empty or ATDC expression vector) or Panc1 cells (C) (with ATDC shRNA1 or 2 expression) (mean ± SE, n=3, *p<0.05 vs control, non-treated cells). (D) Representative bioluminescent images of animals in the control and ATDC shRNA group are shown at 14 (left panels) and 60 (right panels) days after injection, depicting the extent of tumor burden. (E) Western blotting verifies downregulation of β-catenin in tumors derived from β-catenin shRNA transfected Panc1 cells (harvested at 60 days). (F) Average tumor volume measured in animals injected with control shRNA- and β-catenin shRNA-transfected Panc1 cells 60 days post-injection (mean ± SE, n=3, *p<0.05).
Figure 5
Figure 5. Correlation between ATDC and β-catenin expression in pancreatic cancer
(A) Western blot analysis of ATDC and β-catenin expression in BxPC-3, Panc-1, and MiaPaCa-2 cells. β-actin served as a loading control. (B) Immunohistochemical (IHC) staining of samples of normal human pancreas (left panels) and human pancreatic adenocarcinomas (middle and right panels). A correlation between ATDC and β-catenin expression in pancreatic adenocarcinoma samples is evident. The scale bar indicates 50 μm. IHC scores are: moderate (++, intermediate intensity staining) or strong (+++, intense staining).
Figure 6
Figure 6. ATDC stabilizes β-catenin by interacting with disheveled-2 and the β-catenin destruction complex
(A) Pulse-chase assays in Panc1 cells (with or without ATDC silencing) were performed to determine β-catenin stability. (B) β-catenin remaining in (A) was quantitated by densitometry at hours 0, 3 and 6 and normalized relative to the 0 hour time point. Results are the mean ± SE of three independent experiments (*p<0.05 vs control shRNA cells at 6 hours). (C, D) Cell lysates from HEK 293 cells (C) transfected with empty vector or Flag-ATDC, and BxPC3 cells (D) were subjected to immunoprecipitation (IP) with Axin, GSK3β or β-catenin antibodies. Immunocomplexes were resolved by SDS-PAGE and subjected to western analysis with anti-Flag antibody for HEK293 cells (C) and ATDC antibody for BxPC3 cells (D). Blotting with an anti-β-actin antibody revealed equal loading. (E–G) Lysates of HEK 293 cells (E) transfected with empty vector or ATDC expression vector, and control shRNA- or ATDC shRNA1 or 2- expressing Panc1 (F) and BxPC3 (G) cells were subjected to Western blotting with an anti-Dvl-2 antibody. The upper arrow indicates the phosphorylated form and the lower arrow indicates the non-phosphorylated form of Dvl-2. Experiments were performed twice with similar results. (H) Western blotting of 5 samples each of pancreatic adenocarcinoma and normal pancreas. Dvl-1, Dvl-2, Dvl-3 and ATDC expression in pancreatic tissue samples was measured. The experiments were repeated twice with similar results. (I, J) Cell lysates from HEK 293 cells (I) transfected with empty vector or Flag-ATDC and BxPC3 cells (J) were subjected to immunoprecipitation (IP) with Dvl2 or β-catenin antibodies. Immunocomplexes were resolved by SDS-PAGE and subjected to western analysis with an anti-Flag antibody for HEK293 cells (I) and ATDC antibody for BxPC3 cells (J). Blotting with an anti-β-actin antibody showed equal loading. (K) Pulse-chase assays were performed in Panc1 cells (with or without ATDC silencing) to determine Dvl-2 stability. (L) Dvl-2 remaining in (K) was quantitated by densitometry at hours 0 and 6 and normalized relative to the 0 hour time point. Results are the mean ± SE of three independent experiments (*p<0.05 vs control shRNA cells at 6 hours).
Figure 7
Figure 7. The oncogenic effects of ATDC are mediated by Dvl-2
(A. B) The effects of Dvl-2 shRNA 1 or 2 on β-catenin expression is shown in representative western blots of HEK 293 (A) and MiaPaCa2 cells (B) with or without ATDC overexpression. (C.D) TCF reporter activity was assessed in Dvl-2 shRNA 1 or 2-transfected HEK 293 (C) or Mia PaCa2 cells (D) with (+) or without (−) ATDC overexpression. (mean±SE, n=3, *p<0.05 vs empty vector-transfected cells). (E. F) MTS proliferation assays in Dvl-2 shRNA1 or 2-transfected HEK 293 (E) and MiaPaCa2 (F) cells with (+) or without (−)ATDC overexpression (mean±SE, n=3, *p<0.05 vs wild type cells). (G) TCF reporter activity was measured in HEK 293, SW480, DLD-1 and HCT-116 cells with vector (white bars) or ATDC (black bars) transfection using the β-catenin responsive TOPFLASH reporter and the mutant control FOPFLASH reporter (mean±SE, n=3, *p<0.05). (H) Cell proliferation of empty vector- and ATDC expression vector-transfected HEK 293, SW480, DLD-1 and HCT-116 cells are shown (mean±SE, n=3, *p<0.05 vs control, non-treated cells). (I) Varying amounts of wild type β-catenin (β-Cat) or constitutively active mutant β-catenin (S33Y) constructs with TOPFLASH or FOPFLASH reporter constructs were co-transfected into Panc1 cells with control shRNA or ATDC shRNA expression. 48 hours after transfection, TOPFLASH reporter assays were performed. (mean±SE, n=3, *p<0.05, control shRNA vs ATDC shRNA; **p<0.01, Panc1 cells (ATDC shRNA) with β-catenin vs. without β-catenin; and ***p<0.001, Panc1 cells (ATDC shRNA) with S33Y vs without S33Y). (J) Varying amounts of wild type β-catenin (β-Cat) or constitutively active mutant β-catenin (S33Y) constructs were co-transfected into Panc1 cells with control shRNA or ATDC shRNA expression. 48 hours after transfection, cell growth rates were assessed. The experiments were repeated three times and the data is expressed as the mean + SE. (*p<0.05, control shRNA vs ATDC shRNA; **p<0.01, Panc1 cells (ATDC shRNA) with β-catenin vs. without β-catenin; and ***p<0.001, Panc1 cells (ATDC shRNA) with S33Y vs without S33Y).
Figure 8
Figure 8. Model of how ATDC mediates activation of β-catenin signaling in pancreatic cancer cells
(Left panel). In unstimulated normal pancreatic cells lacking ATDC, disheveled-2 (Dvl-2) is in the cytoplasm and is not bound to the Axin/GSK-3β/APC destruction complex. This allows the destruction complex to phosphorylate β-catenin and target it for ubiquitin-mediated degradation. (Right panel). In pancreatic cancer cells expressing high levels of ATDC, ATDC binds to a stabilized Dvl-2, bringing it to the β-catenin destruction complex. Binding of the ATDC and Dvl-2 to the destruction complex inhibits destruction complex function, resulting in the release of β-catenin from the destruction complex, leading to increased β-catenin levels and subsequent activation of downstream target genes.

References

    1. Angers S, Thorpe CJ, Biechele TL, Goldenberg SJ, Zheng N, MacCoss MJ, Moon RT. The KLHL12-Cullin-3 ubiquitin ligase negatively regulates the Wnt-β-catenin pathway by targeting dishevelled for degradation. Nature Cell Biol. 2006;8:348–357. - PubMed
    1. Arumugam T, Simeone DM, Van Golen K, Logsdon CD. S100P promotes pancreatic cancer growth, survival, and invasion. Clin Cancer Res. 2005;11:5356–5364. - PubMed
    1. Bafico A, Liu G, Goldin L, Harris V, Aaronson SA. An autocrine mechanism for constitutive Wnt pathway activation in human cancer cells. Cancer Cell. 2004;6:497–506. - PubMed
    1. Caca K, Kolligs FT, Ji X, Hayes M, Qian J, Yahanda A, Rimm DL, Costa J, Fearon ER. Beta- and gamma-catenin mutations, but not E-cadherin inactivation, underlie T-cell factor/lymphoid enhancer factor transcriptional deregulation in gastric and pancreatic cancer. Cell Growth Differ. 1999;10:369–376. - PubMed
    1. Cao D, Hustinx SR, Sui G, Bala P, Sato N, Martin S, Maitra A, Murphy KM, Cameron JL, Yeo CJ, et al. Identification of novel highly expressed genes in pancreatic ductal adenocarcinomas through a bioinformatics analysis of expressed sequence tags. Cancer Biol Ther . 2004;3:1081–1089. discussion 1090–1081. - PubMed

Publication types

MeSH terms