. 2009 Feb 27;33(4):517-27.
doi: 10.1016/j.molcel.2009.01.021.

Autophagy inhibition compromises degradation of ubiquitin-proteasome pathway substrates

Affiliations

Autophagy inhibition compromises degradation of ubiquitin-proteasome pathway substrates

Viktor I Korolchuk et al. Mol Cell. .

Abstract

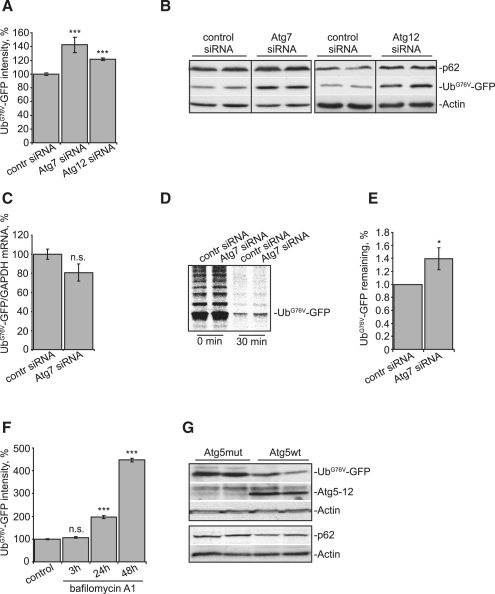
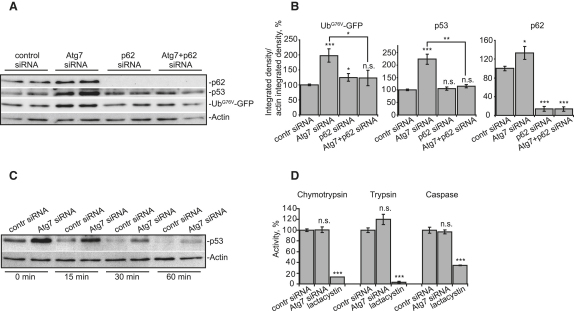
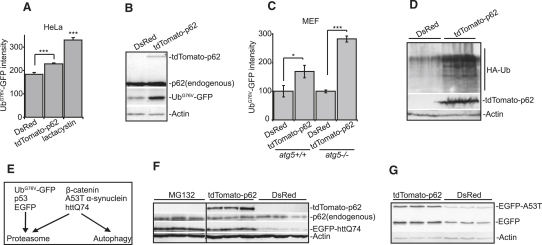
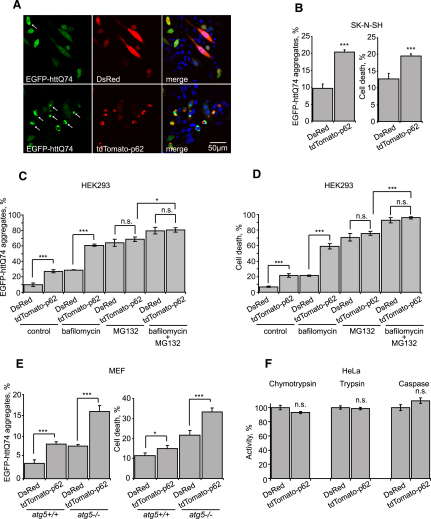
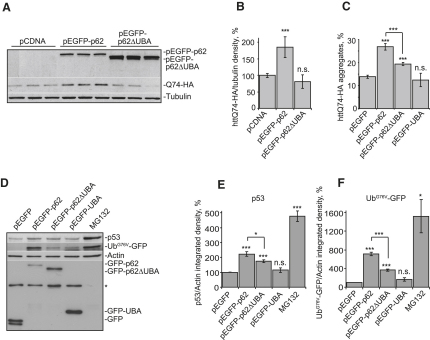
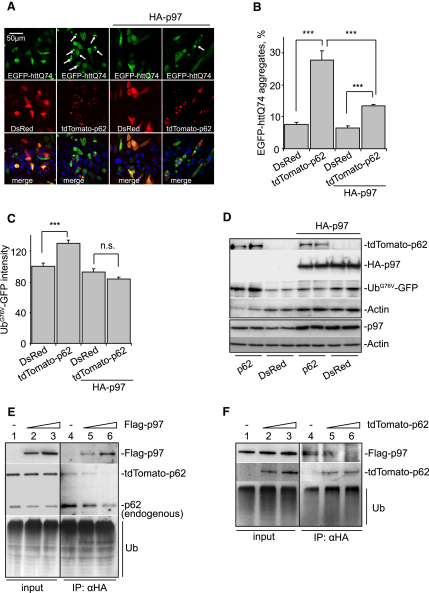
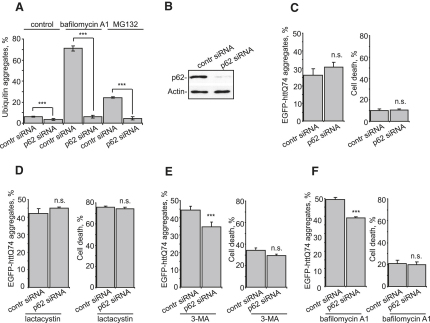
The two main routes that cells use for degrading intracellular proteins are the ubiquitin-proteasome and autophagy-lysosome pathways, which have been thought to have largely distinct clients. Here, we show that autophagy inhibition increases levels of proteasome substrates. This is largely due to p62 (also called A170/SQSTM1) accumulation after autophagy inhibition. Excess p62 inhibits the clearance of ubiquitinated proteins destined for proteasomal degradation by delaying their delivery to the proteasome's proteases. Our data show that autophagy inhibition, which was previously believed to only affect long-lived proteins, will also compromise the ubiquitin-proteasome system. This will lead to increased levels of short-lived regulatory proteins, like p53, as well as the accumulation of aggregation-prone proteins, with predicted deleterious consequences.


Figures

Figure 1
Figure 1
Inhibition of Autophagy Leads to Impairment of Proteasomal Degradation (A and B) siRNA against autophagosomal proteins increases levels of UbG76V-GFP. UbG76V-GFP HeLa cells were transfected with siRNA against two autophagosomal proteins (Atg7 and Atg12), followed by a 72 hr incubation to allow for protein knockdown. GFP fluorescence intensity was quantified by FACS (A), or cells were subjected to immunoblotting (B). (C) Knockdown of Atg7 does not affect mRNA levels of UbG76V-GFP. mRNA from cells treated as in (A) was used to measure amounts of UbG76V-GFP transcript relative to glyceraldehyde 3-phosphate dehydrogenase (GAPDH) by quantitative PCR. (D and E) Knockdown of Atg7 slows degradation of UbG76V-GFP. (D) Levels of [35S]methionine UbG76V-GFP were assessed immediately after radioactive pulse (0 min), or following a 30 min chase in the absence of the radiolabel. Bands larger than the main product likely represent different ubiquitinated species. (E) The ratio of [35S]UbG76V-GFP at 30 min to 0 min was significantly higher in atg7 siRNA-treated cells (n = 3). Control values for 30 min/0 min values are normalized to 1, to allow for comparisons of different gels and experiments. In this experiment, the control value at 30 min was 2.27%, whereas that of the Atg7 knockdown was 2.88%. Similar significant findings were obtained in an independent triplicate experiment. (F) A chemical inhibitor of autophagy, bafilomycin A1, increases levels of UPS reporter in a time-dependent manner. UbG76V-GFP HeLa cells were treated with either DMSO (control) for 48 hr or with 100 nM bafilomycin A1 for the indicated periods of time. GFP fluorescence intensity was quantified by FACS. (G) Expression of wild-type (wt), but not mutant, Atg5 in atg5−/− MEFs reduces levels of UPS reporter. atg5−/− MEFs were transfected with UbG76V-GFP and either wild-type or mutant (K130R) Atg5 (1:3 ratio). Cells were lysed 48 hr posttransfection and subjected to immunoblotting. Note, only wild-type, but not mutant, Atg5 forms a functional conjugate with Atg12. For all of the graphs, data are shown as means ± SE for three separate experiments performed in triplicate. p < 0.05, ∗∗∗p < 0.005, t test; all other comparisons are not significant (n.s.).
Figure 2
Figure 2
Knockdown of p62 Reduces Elevated Levels of UPS Substrates Caused by Impaired Autophagy (A and B) UbG76V-GFP HeLa cells were transfected with control or p62 siRNA. After 48 hr, cells were further transfected with control or atg7 siRNA and incubated for 72 hr. Cells were analyzed by immunoblotting (A), and bands were quantified by densitometry (B). (C) Degradation of endogenous p53 is delayed in cells transfected with siRNA against atg7. After Atg7 knockdown for 96 hr, cells were incubated with 50 μg/ml cycloheximide for the indicated periods, then lysed and subjected to immunoblotting. (D) Knockdown of Atg7 does not affect trypsin-, chymotrypsin-, and caspase-like proteolytic activities of the proteasome. UbG76V-GFP HeLa cells were transfected with control or atg7 siRNA as in (A). A total of 72 hr posttransfection, cells were lysed and proteasome activities measured. Cells treated with the proteasome inhibitor lactacystin were used as a positive control. For all of the graphs, data are shown as means ± SE for three separate experiments performed in triplicate. p < 0.05, ∗∗p < 0.01, ∗∗∗p < 0.005, t test; all other comparisons are not significant (n.s.).
Figure 3
Figure 3
Overexpression of p62 Inhibits Degradation of Proteasomal Substrates (A) p62 overexpression increases levels of UbG76V-GFP. HeLa cells were cotransfected with UbG76V-GFP and either DsRed or tdTomato-p62 (1:3 ratio) and incubated for 48 hr. A separate set of UbG76V-GFP/DsRed-transfected cells were treated with 10 μM lactacystin 16 hr prior to analysis as a positive control. The GFP fluorescence intensity of double-positive green/red cells was quantified by FACS. (B) Levels of UbG76V-GFP are increased in the presence of overexpressed p62. SK-N-SH cells were transfected as in (A). After 48 hr, cells were harvested and immunoblotted. The levels of exogenous p62 appear to be low because they are measured in the whole cell population from a transient transfection experiment, where only a proportion of cells express the transgene. (C) p62 overexpression causes accumulation of UbG76V-GFP in wild-type and autophagy-deficient cells. atg5+/+ and atg5−/− MEFs were transfected as in (A), and the GFP fluorescence intensity of double-positive green/red cells was analyzed by FACS. We normalized the levels in both atg5+/+ and atg5−/− MEFs in control conditions to 100% to facilitate comparisons; however, the levels of UbG76V-GFP are higher in the autophagy-deficient MEFs. (D) Overexpression of p62 leads to accumulation of ubiquitinated proteins. SK-N-SH cells were transfected with HA-Ub and either DsRed or tdTomato-p62 (1:1 ratio), incubated for 48 hr, and analyzed for levels of HA-Ub-labeled proteins by immunoblotting. (E) Schematic diagram of degradation pathways for proteins used in this study. (F) p62 increases levels of soluble polyQ. HeLa cells were transfected with EGFP-httQ74 and either DsRed or tdTomato-p62 (1:3 ratio) and were incubated for 48 hr. A separate set of EGFP-httQ74/DsRed-transfected cells was treated with the proteasomal inhibitor MG132, as a positive control. (G) p62 increases levels of soluble mutant α-synuclein (EGFP-A53T) and EGFP. HeLa cells were transfected with EGFP-A53T, EGFP, and either DsRed or tdTomato-p62 (1:1:3 ratio) and were incubated for 48 hr prior to immunoblotting. For all of the graphs, data are shown as means ± SE for three separate experiments performed in triplicate. p < 0.05, ∗∗∗p < 0.005, t test; all other comparisons are not significant (n.s.).
Figure 4
Figure 4
Overexpression of p62 Increases Aggregation and Toxicity of httQ74 (A and B) p62 overexpression increases polyQ aggregation and toxicity. SK-N-SH cells were cotransfected with EGFP-httQ74 and DsRed (control) or tdTomato-p62 at 1:3 ratios. Representative images of SK-N-SH cells are shown in (A). White arrows indicate cells containing EGFP-httQ74 aggregates. (B) The percentage of green/red double-positive cells with EGFP-httQ74 aggregates or apoptotic nuclear morphology was assessed 24 hr posttransfection. (C and D) p62 increases polyQ aggregation and toxicity in cells in which autophagy, but not the proteasome, is inhibited. HEK293 cells were transfected as in (A), followed by a 24 hr bafilomycin A1 and/or MG132 treatment. The percentage of transfected cells (red/green positive) with polyQ aggregates and cell death were quantified. (E) p62 increases toxicity and aggregation of polyQ in autophagy-deficient atg5−/− cells. atg5+/+ and atg5−/− MEFs were transfected with EGFP-httQ74 and either DsRed or tdTomato-p62 (1:3 ratio). The percentage of green/red double-positive cells with EGFP-httQ74 aggregates or apoptotic nuclear morphology was assessed at 48 hr post-transfection. (F) Overexpression of p62 does not affect trypsin-, chymotrypsin-, and caspase-like proteolytic activities of the proteasome. HeLa cells were transfected with either DsRed or tdTomato-p62 and incubated for 48 hr. Fluorescent cells were sorted and lysed, and proteasome activities were measured. For all of the graphs, data are shown as means ± SE for three separate experiments performed in triplicate. p < 0.05, ∗∗∗p < 0.005, t test; all other comparisons are not significant (n.s.).
Figure 5
Figure 5
p62 Increases Levels of Proteasome Substrates in a UBA-Dependent Manner (A and B) Overexpression of full-length, but not truncated, p62 increases levels of soluble polyQ. HeLa cells were transfected with httQ74-HA and either pcDNA (control), pEGFP-p62, or pEGFP-p62ΔUBA at 1:3 ratios and were incubated for 48 hr. (B) Cells were immunoblotted, and bands were quantified by densitometry. (C) Effect of p62 overexpression on polyQ aggregation is dependent on UBA. SK-N-SH cells were cotransfected with httQ74-HA and either pEGFP-C1 (control), pEGFP-p62, pEGFP-p62ΔUBA, or pEGFP-UBA at 1:3 molar ratios. A total of 24 hr posttransfection, cells were immunostained for HA. The percentage of double-positive cells with httQ74 aggregates was counted. (D–F) Overexpression of p62 increases levels of p53 and UbG76V-GFP. HeLa cells were transfected with UbG76V-GFP and either pEGFP-C1 (control), pEGFP-p62, pEGFP-p62ΔUBA, or pEGFP-UBA at 1:3 molar ratios. A total of 24 hr posttransfection, cells were analyzed by immunoblotting. (D) Cells transfected only with UbG76V-GFP were incubated with MG132 for 3 hr prior to lysis, as a positive control (D). The asterisk denotes a nonspecific band. (E and F) Levels of endogenous p53 and UbG76V-GFP were quantified by densitometry. For all of the graphs, data are shown as means ± SE for three separate experiments performed in triplicate. p < 0.05, ∗∗∗p < 0.005, t test; all other comparisons are not significant (n.s.).
Figure 6
Figure 6
p97 Alleviates the Effects of p62 Overexpression (A and B) p97 overexpression rescues increased polyQ aggregation caused by p62 overexpression. SK-N-SH cells were cotransfected with EGFP-httQ74, along with either DsRed or tdTomato-p62, and either pcDNA3.1 or HA-p97 at 0.5:1:1 ratio. (A) After 24 hr of incubation, cells were imaged. White arrows indicate cells containing EGFP-httQ74 aggregates. (B) The percentage of green/red double-positive cells with EGFP-httQ74 aggregates was quantified. (C and D) p97 overexpression reduces elevated UbG76V-GFP levels caused by p62 overexpression. SK-N-SH cells were transfected as in (A), but EGFP-httQ74 was replaced with UbG76V-GFP. A total of 48 hr posttransfection, UbG76V-GFP levels were assessed either by FACS (C) or immunoblotting (D). (E) p97 competes with p62 for ubiquitin binding. HeLa cells were cotransfected with HA-Ub, tdTomato-p62, and either pcDNA3.1 (lanes 1 and 4) or Flag-p97 at a p62:p97 molar ratio of 1:1 (lanes 2 and 5) or 1:2 (lanes 3 and 6). A total of 24 hr posttransfection, MG132 was added and cells were incubated for an additional 24 hr. Cells were subjected to immunoprecipitation with anti-HA antibody. Lysates (input) and immunoprecipitated samples (IP: αHA) were probed with antibodies against Flag epitope, p62, or ubiquitin. (F) p62 prevents binding of p97 to ubiquitinated proteins. HeLa cells were cotransfected with HA-Ub, Flag-p97, and either pcDNA3.1 (lanes 1 and 4) or tdTomato-p62 at a p97:p62 DNA molar ratio of 1:1 (lanes 2 and 5) or 1:2 (lanes 3 and 6). A total of 24 hr posttransfection, MG132 was added for an additional 24 hr. Cells were subjected to immunoprecipitation as in (E). For all of the graphs, data are shown as means ± SE for three separate experiments performed in triplicate. ∗∗∗p < 0.005, t test; all other comparisons are not significant (n.s.).
Figure 7
Figure 7
Effect of p62 on Formation of Ubiquitinated Aggregates (A) p62 knockdown reduces ubiquitin-positive aggregates. HeLa cells were transfected with control or p62-specific siRNA, followed by a 72 hr incubation. Cells were treated with bafilomycin A1 or MG132 for the final 16 hr, before immunostaining with anti-ubiquitin antibody. The percentage of cells containing ubiquitin-positive aggregates was analyzed. (B) Efficiency of siRNA knockdown. HEK293 cells were transfected as in (A). Cells were analyzed by immunoblotting for endogenous p62. (C) Knockdown of p62 does not affect polyQ aggregation and toxicity. HEK293 cells were transfected with siRNA as in (A). Cells were then retransfected with the same amount of siRNA together with EGFP-httQ74 and incubated for an additional 24 hr before polyQ aggregation and cell death were assessed. (D) Knockdown of p62 does not affect polyQ aggregation and toxicity in the presence of a proteasomal inhibitor. Cells were retransfected as in (C) and incubated for 24 hr in the presence of lactacystin before polyQ aggregation and cell death were assessed. (E and F) Knockdown of p62 decreases the number of polyQ aggregates in cells with inhibited autophagy. Cells were transfected as in (C), followed by a 24 hr incubation with 3-MA (E) or bafilomycin A1 (F). polyQ aggregation and cell death were assessed. For all of the graphs, data are shown as means ± SE for three separate experiments performed in triplicate. ∗∗∗p < 0.005, t test; all other comparisons are not significant (n.s.).

References

    1. Aberle H., Bauer A., Stappert J., Kispert A., Kemler R. β-catenin is a target for the ubiquitin-proteasome pathway. EMBO J. 1997;16:3797–3804. - PMC - PubMed
    1. Bennett E.J., Shaler T.A., Woodman B., Ryu K.-Y., Zaitseva T.S., Becker C.H., Bates G.P., Schulman H., Kopito R.R. Global changes to the ubiquitin system in Huntington's disease. Nature. 2007;448:704–708. - PubMed
    1. Bjorkoy G., Lamark T., Brech A., Outzen H., Perander M., Overvatn A., Stenmark H., Johansen T. p62/SQSTM1 forms protein aggregates degraded by autophagy and has a protective effect on huntingtin-induced cell death. J. Cell Biol. 2005;171:603–614. - PMC - PubMed
    1. Boyault C., Zhang Y., Fritah S., Caron C., Gilquin B., Kwon S.H., Garrido C., Yao T.P., Vourc'h, C.Matthias P. HDAC6 controls major cell response pathways to cytotoxic accumulation of protein aggregates. Genes Dev. 2007;21:2172–2181. - PMC - PubMed
    1. Dantuma N.P., Lindsten K., Glas R., Jellne M., Masucci M.G. Short-lived green fluorescent proteins for quantifying ubiquitin/proteasome-dependent proteolysis in living cells. Nat. Biotechnol. 2000;18:538–543. - PubMed

Publication types