. 2009:80:33-49.
doi: 10.1016/S0083-6729(08)00602-X.

The structure and function of insulin: decoding the TR transition

Affiliations

The structure and function of insulin: decoding the TR transition

Michael A Weiss. Vitam Horm. 2009.

Abstract

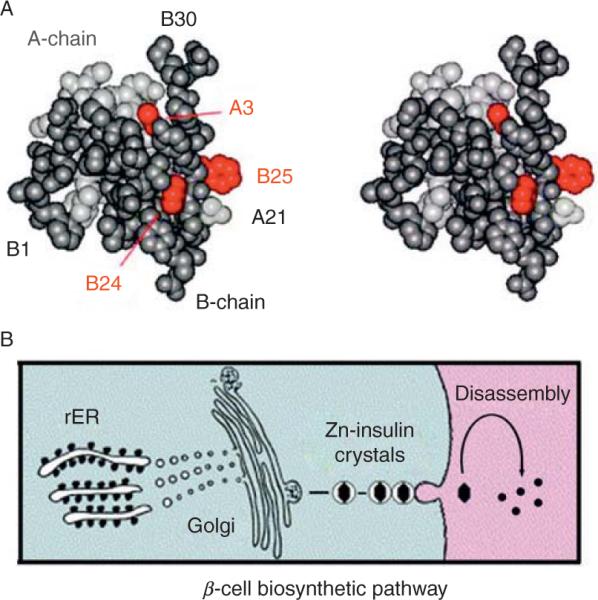
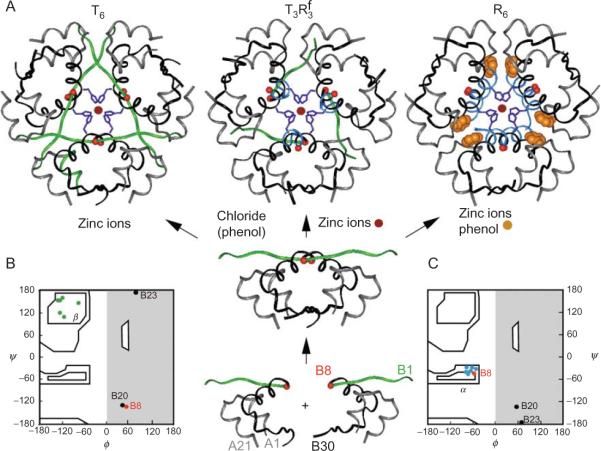
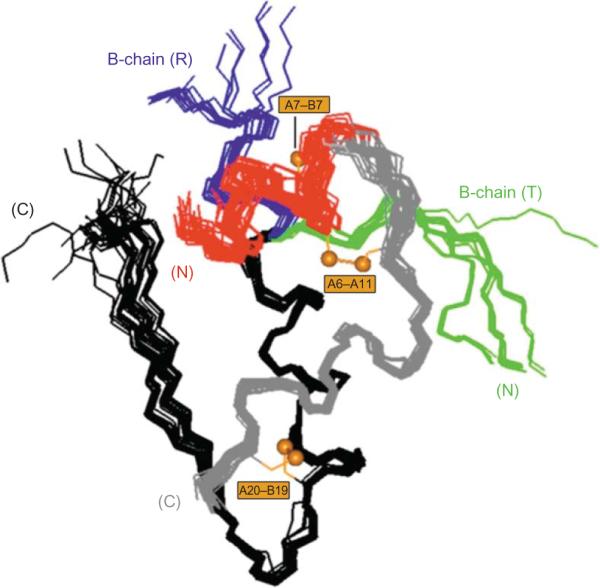
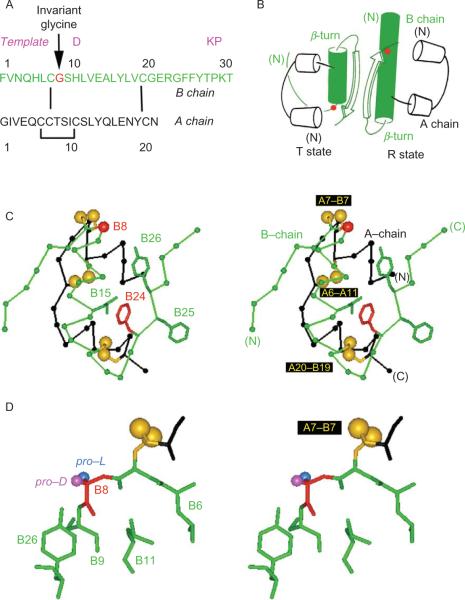
Crystal structures of insulin are remarkable for a long-range reorganization among three families of hexamers (designated T(6), T(3)R(3)(f), and R(6)). Although these structures are well characterized at atomic resolution, the biological implications of the TR transition remain the subject of speculation. Recent studies indicate that such allostery reflects a structural switch between distinct folding-competent and active conformations. Stereospecific modulation of this switch by corresponding d- and l-amino-acid substitutions yields reciprocal effects on protein stability and receptor-binding activity. Naturally occurring human mutations at the site of conformational change impair the folding of proinsulin and cause permanent neonatal-onset diabetes mellitus. The repertoire of classical structures thus foreshadows the conformational lifecycle of insulin in vivo. By highlighting the richness of information provided by protein crystallography-even in a biological realm far removed from conditions of crystallization-these findings validate the prescient insights of the late D. C. Hodgkin. Future studies of the receptor-bound structure of insulin may enable design of novel agonists for the treatment of diabetes mellitus.


Figures

Figure 2.1
Figure 2.1
Globular structure of an insulin monomer and pathway of insulin biosyn-thesis. (A) Space-filling model of an insulin monomer highlighting sites of classical diabetes-associated mutations (red): ValA3→Leu, PheB24→ Ser, and PheB25→Leu (Shoelson et al., 1983). The A- and B-chains are otherwise shown in light and dark gray, respectively. Atomic coordinates were obtained from Protein Databank entry 4INS (2-Zn molecule 1). (B) Nascent proinsulin folds as a monomer in ER wherein zinc-ion concentration is low; in Golgi apparatus zinc-stabilized proinsulin hexamer assembles. The prohormone is processed by cleavage of connecting peptide in post-Golgi vescicles to yield mature insulin. Zinc-insulin crystals are observed in secretory granules. Insulin hexamers dissociate in the bloodstream to release active zinc-free monomers.
Figure 2.2
Figure 2.2
Structural families of insulin hexamers. (A) Left to right, ribbon models of T6, T3R3f, and R6 zinc insulin hexamers. Central panel indicates pathway of insulin assembly and regulators of conformational reorganization (arrows). The Cα positions of GlyB8 are indicated by red balls; the variable secondary structures of the N-terminal segment of the B-chain (residues B1–B7) are shown highlighted in green (extended in T-state) or powder blue (α-helical in R-state). The B-chain is otherwise shown in black, and A-chain in gray. The side chains of HisB10 in the metal-ion binding sites are shown in dark blue; zinc ions in magenta; and phenol in burnt amber. (B and C) The TR transition is associated with a conformational change of GlyB8 from right to left in the Ramachandran plot. Main-chain dihedral conformations of the three glycines in the B-chain (residues B8, B20, and B23) and residues B2–B8 in a representative T-state (B) or R-state (C) protomer. The conformation of GlyB8 is indicated by red; black circles indicate GlyB20 and GlyB23. Residues B2–B7 are shown in green (in β-region in T-state) or blue (within α-helical island in R-state).
Figure 2.3
Figure 2.3
Structural variation among crystallographic protomers. Superposition of crystallographic protomers (15 T states and 15 R states). The structures were aligned according the main-chain atoms of residues B9–B24 and A12–A21. The A1–A8 α-helix in each protomer is shown in red; the variable secondary structure of the N-terminal segment of the B-chain is shown in green (extended in T state; right) or blue (extended α-helix in R state; left). Structures were obtained from the following entries in the Protein Data Bank: (T states), 4INS, 1APH, 1BPH, 1CPH, 1DPH, 1TRZ, 1TYL, 1TYM, 2INS, 1ZNI, 1LPH, 1G7A, 1MSO; (R states), 1EV6, 1ZNJ, 1TRZ, 1ZNI, 1LPH.
Figure 2.4
Figure 2.4
Conformation of GlyB8 in a T-state-specific α-turn. (A) Sequence of B chain (top) and A chain (bottom); arrow indicates invariant GlyB8 (red). Shown above B chain in magenta are the three substitutions in the monomeric DKP template. (B) Cylinder models of TR dimer based on crystal structure of zinc insulin hexamers (PDB ID: 1TRZ). The T state is at left and R state at right. B-chain α-helices are shown in green; the α-carbons of GlyB8 are shown as red circles. Three families of hexamers have been characterized, designated T6, T3R3f, and R6. The R-state conformation has only been observed within hexamers. (C) Structure of insulin T state (stereo pair) showing positions of selected side chains (labeled at left) relative to GlyB8 Cα (red) and disulfide bridges (gold; labeled at right). The B chain is shown in green, and A chain in black. (D) Structure of T-state-specific B7–B10 β-turn (stereo pair). Main chain of GlyB8 is shown in red; its pro-l and pro-d Hα atoms are highlighted in blue and magenta, respectively. This figure is reprinted from Hua et al. (2006b).
Figure 2.5
Figure 2.5
NMR-derived solution structures of d-SerB8 and l-SerB8 analogs of an engineered insulin monomer. Front and back views of (A) d-SerB8-DKP-insulin and (B) l-SerB8-DKP-insulin. In each case the A chain is shown in gray, and B chain in blue. The d- and l-SerB8 side chains are shown in green and purple, respectively (arrow-heads). Ribbons indicate mean structure of DKP-insulin. This figure is reprinted from Hua et al. (2006b).
Figure 2.6
Figure 2.6
Structure of proinsulin and T-state-specific environment of HisB5. (A) Sequence of human proinsulin: insulin moiety is shown in red (A chain) and blue (B chain). The connecting region is shown in black: flanking dibasic cleavage sites (filled circles) and C-peptide (open circles). (B) Structural model of insulin-like moiety and disordered connecting peptide (dashed line). Cystines are labeled in yellow boxes. (C) Structural environment of HisB5 within A-chain-related crevice. Structures are drawn from T-state coordinates given by PDB code in legend to Figure 2.3. This figure is reprinted from Hua et al. (2006a).
Figure 2.7
Figure 2.7
Structural environment of residue B5 in T6 hexamer and T-state protomers. (A) Spacing filling model of T6 hexamer showing side chain of HisB5 (red) lying along protein surface near bound water molecules (blue). (B) Stick model of single T-state protomer with B-chain in black and A-chain in gray. Red box encloses environment of HisB5 (red) in inter-chain crevice near A7–B7 and A6–A11 disulfide bridges (sulfur atoms shown in gold). (C) Expansion of boxed region in panel B providing stereo view of packing of HisB5. (D) Corresponding stereo view of ArgB5 (red) in crystallographic T-state protomer. Analogous side-chain NH functions of HisB5 and ArgB5 are near the main-chain of the A-chain. Cystine A7–B7 in each case lies on the protein surface whereas cystine A6–A11 packs within the core of the protomer. Bound water molecules near respective B5-related crevices are shown as blue spheres. This figure is reprinted from Wan et al. (2008).

References

    1. Adams MJ, Blundell TL, Dodson EJ, Dodson GG, Vijayan M, Baker EN, Hardine MM, Hodgkin DC, Rimer B, Sheet S. Structure of rhombohedral 2 zinc insulin crystals. Nature. 1969;224:491–495.
    1. Araki E, Oyadomari S, Mori M. Endoplasmic reticulum stress and diabetes mellitus. Intern. Med. 2003;42:7–14. - PubMed
    1. Baker EN, Blundell TL, Cutfield JF, Cutfield SM, Dodson EJ, Dodson GG, Hodgkin DM, Hubbard RE, Isaacs NW, Reynolds CD. The structure of 2Zn pig insulin crystals at 1.5Å resolution. Philos. Trans. R. Soc. Lond. B Biol. Sci. 1988;319:369–456. - PubMed
    1. Bentley G, Dodson E, Dodson G, Hodgkin D, Mercola D. Structure of insulin in 4-zinc insulin. Nature. 1976;261:166–168. - PubMed
    1. Bentley G, Dodson G, Lewitova A. Rhombohedral insulin crystal transformation. J. Mol. Biol. 1978;126:871–875. - PubMed

Publication types