. 2009 Mar 31;106(13):5129-34.
doi: 10.1073/pnas.0900336106. Epub 2009 Feb 27.

A unified model of protein dynamics

Affiliations

A unified model of protein dynamics

Hans Frauenfelder et al. Proc Natl Acad Sci U S A. .

Abstract

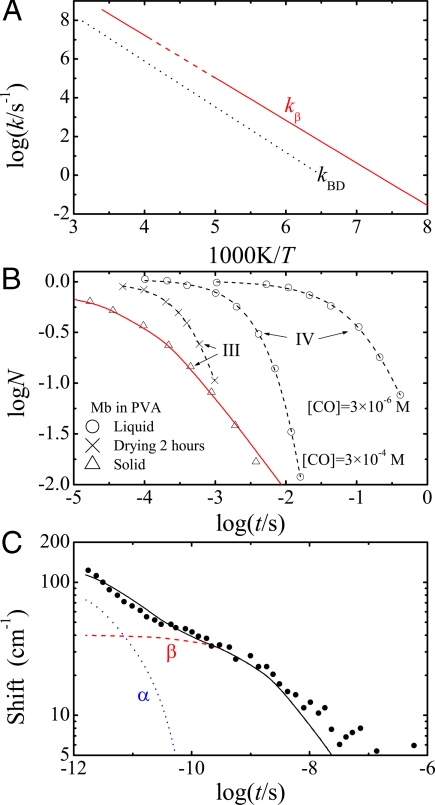
Protein functions require conformational motions. We show here that the dominant conformational motions are slaved by the hydration shell and the bulk solvent. The protein contributes the structure necessary for function. We formulate a model that is based on experiments, insights from the physics of glass-forming liquids, and the concepts of a hierarchically organized energy landscape. To explore the effect of external fluctuations on protein dynamics, we measure the fluctuations in the bulk solvent and the hydration shell with broadband dielectric spectroscopy and compare them with internal fluctuations measured with the Mössbauer effect and neutron scattering. The result is clear. Large-scale protein motions are slaved to the fluctuations in the bulk solvent. They are controlled by the solvent viscosity, and are absent in a solid environment. Internal protein motions are slaved to the beta fluctuations of the hydration shell, are controlled by hydration, and are absent in a dehydrated protein. The model quantitatively predicts the rapid increase of the mean-square displacement above approximately 200 K, shows that the external beta fluctuations determine the temperature- and time-dependence of the passage of carbon monoxide through myoglobin, and explains the nonexponential time dependence of the protein relaxation after photodissociation.


Conflict of interest statement

The authors declare no conflict of interest.

Figures

Fig. 1.
Fig. 1.
The hydration shell of myoglobin (Mb). Diagram of myoglobin (blue surface) with 1,911 water molecules (CPK model), the approximate number needed for optimal function (h = 2). The waters form a shell ≈5 Å thick around the protein. Approximately 200 water molecules are distinguishable from background with high-resolution X-ray crystallography.
Fig. 2.
Fig. 2.
Relaxation processes in Mb. (A) Arrhenius plot of the α and the βh processes of Mb embedded in a 50:50 (wt/wt) glycerol/water solvent with a water–protein weight ratio h = 1, measured with dielectric relaxation spectroscopy. The α process (blue) follows a VTF relation (Eq. 2). The βh process (red) approximately follows an Arrhenius law. (B) Arrhenius plot of the βh processes for Mb embedded in PVA for various values of the hydration h. (C) Dielectric spectra of 50:50 (wt/wt) glycerol/water samples at 160 K for h = 0.5, 2.5, and ∞ (no Mb).
Fig. 3.
Fig. 3.
The energy landscape of myoglobin. (A) A 1-dimensional cross-section through the energy landscape of myoglobin as plotted in 1989 (33). It was assumed that the barriers between substates were a property of the protein and that the hierarchy could be defined by the height of the barriers. (B) Present view. Projection of the high-dimensional energy landscape (EL) on a 2-dimensional conformation plane. Each small circle in the plane represents a conformational substate, specified by a vector x(t) ≡ {x1, x2, …, xN} for N atoms. Only a very very small fraction of substates are shown. At the ambient temperature a protein starting in a specific CS makes a random walk in tier 2 with the average time for each step given by 1/kα and it carves out an α basin. In terms of A these fluctuations represent the “equilibrium fluctuations 2” or EF2. After an average time 1/kβ ≈ 10−8 s the protein jumps to another α basin. It continues the random walk (Lévy walk) and carves out a β basin. The random walk continues even if the protein undergoes a process, for instance by a jump from A0 to A1. At low temperatures, kβkα and the protein hops between α basins faster than individual basins are explored.
Fig. 4.
Fig. 4.
The temperature dependence of the dielectric relaxation area aβ(T) and the recoilless fraction fc(T) of the Mössbauer effect. The similar temperature dependence between the two independently measured functions demonstrates that the internal protein motions, characterized by fc(T), are determined by the external βh process, characterized by aβ(T). Note that fc(T) is difficult to measure at low temperatures because a small change in 〈x2v changes fc(T) strongly. It is also difficult to measure at high temperatures, because the elastic component becomes very small. (Inset) The temperature dependence of the mean-square displacement (〈x2(T)〉) (msd) of the heme iron in Mb. The msd (black circles) was determined by using the Mössbauer effect for 57Fe in a metmyoglobin crystal (38). At ≲200 K, the msd is due to vibrations and is nearly linear in T. At ≳200 K, the msd increases rapidly. The red diamonds are the msd calculated by assuming the conformational part of the msd is dominated by βh fluctuations.
Fig. 5.
Fig. 5.
The determination of the area fraction aβ(T) by using dielectric relaxation spectra. The Mb was embedded in solid PVA (h = 0.4) so that the α relaxation was eliminated. (A) The fitted dielectric relaxation spectrum of the βh relaxation in Mb at 265 K. The vertical line denoted by k gives the dephasing rate corresponding to τ = 140 ns, the mean lifetime of 57Fe. The fractional area to the left of k is aβ(T). (B) Dielectric loss spectra ε″(T) at different temperatures. The symbols are from the measurement and the lines plot the fits to Eq. 5.
Fig. 6.
Fig. 6.
The βh relaxation predicts internal motions. (A) The rate coefficient kBD(T) for the passage of CO from the heme pocket to the Xe-1 cavity follows kβ(T) over nearly 8 orders of magnitude. (B) Rebinding of CO to Mb in PVA. The data are from figure 6 of ref. . The curves denoted by IV are obtained in a freshly prepared sample of Mb in PVA while the sample is still liquid. After drying for ≈2 h, process IV disappears and the exponential but [CO]-independent and faster process III appears. On complete drying, when PVA is solid, the nonexponential curve III is obtained. The red solid line is the time dependence as predicted by the βh fluctuation data. (C) The relaxation of the charge-transfer band III in Mb after photodissociation at room temperature (48). The shift of band III after photodissociation is plotted versus time. The highly nonexponential time dependence of the band position shift can be reproduced with the sum of an α process predicted by Eq. 8 and a βh process predicted by Eq. 9.

Similar articles

Cited by

References

    1. Henzler-Wildman K, Kern D. Dynamic personalities of proteins. Nature. 2007;450:964–972. - PubMed
    1. Fenimore PW, Frauenfelder H, McMahon BH, Parak FG. Slaving: Solvent fluctuations dominate protein dynamics and functions. Proc Natl Acad Sci USA. 2002;99:16047–16051. - PMC - PubMed
    1. Frauenfelder H, Fenimore PW, Chen G, McMahon BH. Protein folding is slaved to solvent motions. Proc Natl Acad Sci USA. 2006;103:15469–15472. - PMC - PubMed
    1. Lubchenko V, Wolynes PG, Frauenfelder H. Mosaic energy landscapes of liquids and the control of protein conformational dynamics by glass-forming solvents. J Phys Chem B. 2005;109:7488–7499. - PubMed
    1. Fenimore PW, Frauenfelder H, McMahon BH, Young RD. Bulk-solvent and hydration-shell fluctuations, similar to α- and β-fluctuations in glasses, control protein motions and functions. Proc Natl Acad Sci USA. 2004;101:14408–14413. - PMC - PubMed

Publication types

LinkOut - more resources