

A Bayesian approach for evaluating the impact of historical events on rates of diversification
- PMID: 19251663
- PMCID: PMC2648891
- DOI: 10.1073/pnas.0807230106
A Bayesian approach for evaluating the impact of historical events on rates of diversification
Abstract
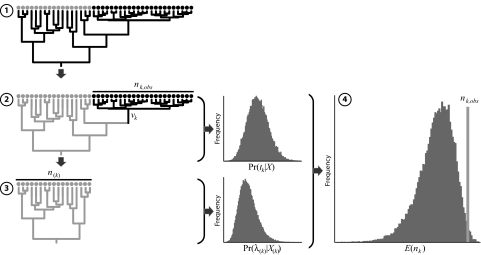
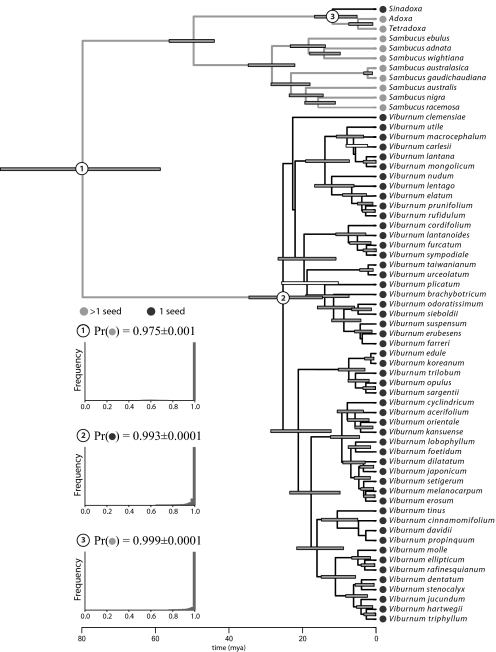
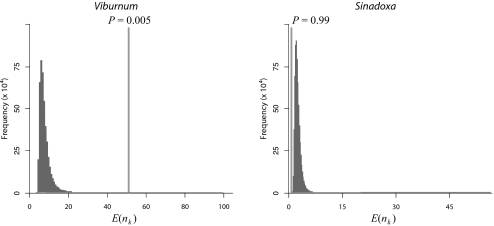
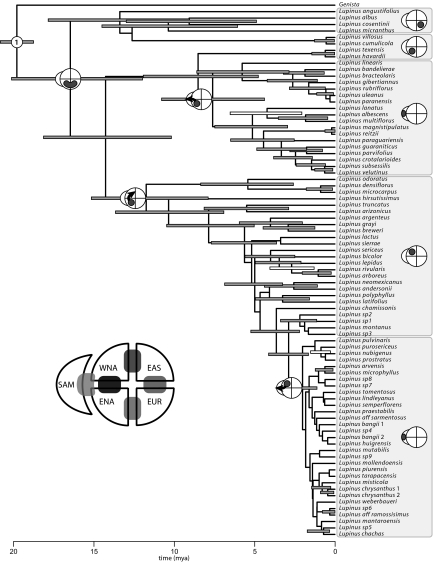
Evolutionary biologists often wish to explore the impact of a particular historical event (e.g., the origin of a novel morphological trait, an episode of biogeographic dispersal, or the onset of an ecological association) on rates of diversification (speciation minus extinction). We describe a Bayesian approach for evaluating the correlation between such events and differential rates of diversification that relies on cross-validation predictive densities. This approach exploits estimates of the marginal posterior probability for the rate of diversification (in the unaffected part of the tree) and the marginal probability for the timing of the event to generate a predictive distribution of species diversity that would be expected had the event not occurred. The realized species diversity can then be compared to this predictive diversity distribution to assess whether rates of diversification associated with the event are significantly higher or lower than expected. Although simple, this Bayesian approach provides a robust inference framework that accommodates various sources of uncertainty, including error associated with estimates of divergence times, diversification-rate parameters, and event history. Furthermore, the proposed approach is relatively flexible, allowing exploration of various types of events (including changes in discrete morphological traits, episodes of biogeographic movement, etc.) under both hypothesis-testing and data-exploration inference scenarios. Importantly, the cross-validation predictive densities approach facilitates evaluation of both replicated and unique historical events. We demonstrate this approach with empirical examples concerning the impact of morphological and biogeographic events on rates of diversification in Adoxaceae and Lupinus, respectively.
Conflict of interest statement
The authors declare no conflict of interest.
Figures
Similar articles
-
Correlates of diversification in the plant clade Dipsacales: geographic movement and evolutionary innovations.Am Nat. 2007 Aug;170 Suppl 2:S28-55. doi: 10.1086/519460. Am Nat. 2007. PMID: 17874383
-
Accelerated diversifications in three diverse families of morphologically complex lichen-forming fungi link to major historical events.Sci Rep. 2019 Jun 28;9(1):8518. doi: 10.1038/s41598-019-44881-1. Sci Rep. 2019. PMID: 31253825 Free PMC article.
-
Molecular phylogeny and historical biogeography of Nacella (Patellogastropoda: Nacellidae) in the Southern Ocean.Mol Phylogenet Evol. 2010 Jul;56(1):115-24. doi: 10.1016/j.ympev.2010.02.001. Epub 2010 Feb 6. Mol Phylogenet Evol. 2010. PMID: 20139020
-
Adaptive radiation versus 'radiation' and 'explosive diversification': why conceptual distinctions are fundamental to understanding evolution.New Phytol. 2015 Jul;207(2):297-303. doi: 10.1111/nph.13482. Epub 2015 Jun 1. New Phytol. 2015. PMID: 26032979 Review.
-
Explaining the uniqueness of the Cape flora: incorporating geomorphic evolution as a factor for explaining its diversification.Mol Phylogenet Evol. 2009 Apr;51(1):64-74. doi: 10.1016/j.ympev.2008.05.034. Epub 2008 Jun 4. Mol Phylogenet Evol. 2009. PMID: 18691908 Review.
Cited by
-
Heterostyly accelerates diversification via reduced extinction in primroses.Proc Biol Sci. 2014 Apr 23;281(1784):20140075. doi: 10.1098/rspb.2014.0075. Print 2014 Jun 7. Proc Biol Sci. 2014. PMID: 24759859 Free PMC article.
-
Multiple continental radiations and correlates of diversification in Lupinus (Leguminosae): testing for key innovation with incomplete taxon sampling.Syst Biol. 2012 May;61(3):443-60. doi: 10.1093/sysbio/syr126. Epub 2012 Jan 5. Syst Biol. 2012. PMID: 22228799 Free PMC article.
-
Marginal diversity analysis of conservation of Chinese domestic duck breeds.Sci Rep. 2019 Sep 11;9(1):13141. doi: 10.1038/s41598-019-49652-6. Sci Rep. 2019. PMID: 31511604 Free PMC article.
-
Clade age and diversification rate variation explain disparity in species richness among water scavenger beetle (Hydrophilidae) lineages.PLoS One. 2014 Jun 2;9(6):e98430. doi: 10.1371/journal.pone.0098430. eCollection 2014. PLoS One. 2014. PMID: 24887453 Free PMC article.
-
Cox1 barcoding versus multilocus species delimitation: validation of two mite species with contrasting effective population sizes.Parasit Vectors. 2019 Jan 5;12(1):8. doi: 10.1186/s13071-018-3242-5. Parasit Vectors. 2019. PMID: 30611284 Free PMC article.
References
-
- Paradis E. Statistical analysis of diversification with species traits. Evolution. 2005;59:1–12. - PubMed
-
- Ree RH. Detecting the historical signature of key innovations using stochastic models of character evolution and cladogenesis. Evolution. 2005;59:257–265. - PubMed
-
- Maddison WP, Midford PE, Otto SP. Evaluating a binary character's effect on speciation and extinction. Syst Biol. 2007;56:701–710. - PubMed
-
- Gelfand AE. In: Markov Chain Monte Carlo in Practice. Gilks WR, Richardson S, Spiegelhalter D, editors. New York: Chapman & Hall; 1996. pp. 145–161.
-
- Gelman AE, Dey DK, Chang H. In: Bayesian Statistics. Bernardo JM, Berger JO, Dawid AP, Smith AFM, editors. Vol 4. New York: Oxford Univ Press; 1992. pp. 147–167.
MeSH terms
LinkOut - more resources
Full Text Sources
