

Adaptor protein SLAT modulates Fcgamma receptor-mediated phagocytosis in murine macrophages
- PMID: 19251698
- PMCID: PMC2673257
- DOI: 10.1074/jbc.M809712200
Adaptor protein SLAT modulates Fcgamma receptor-mediated phagocytosis in murine macrophages
Abstract
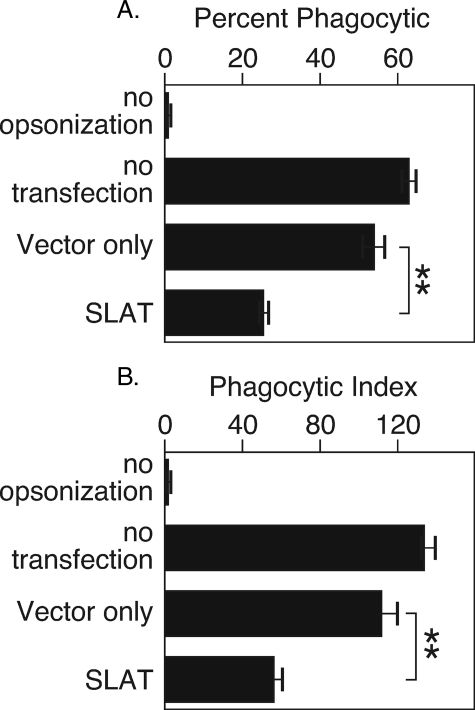
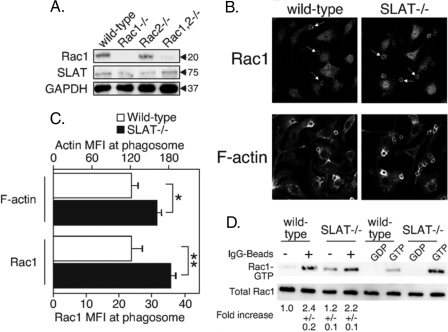
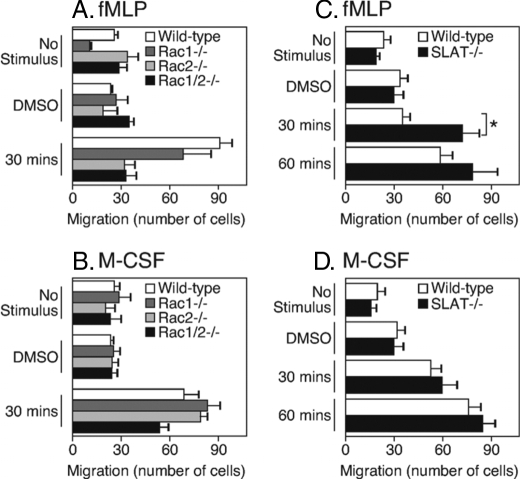
SLAT (SWAP-70-like adaptor protein of T cells) is an adaptor protein expressed in cells of the hematopoietic system. SLAT interacts with and alters the function of small GTPase Rac1 in fibroblasts. In these nonhematopoietic models, the SLAT-Rac interaction leads to changes in F-actin and causes cytoskeletal reorganization. In T cells, SLAT expression regulates the development of T helper cells through Cdc42- and Rac1-mediated activation of the NF-AT transcription factor. Here we show that SLAT is expressed in macrophages. Overexpression of SLAT in a macrophage cell line inhibits the IgG Fcgamma receptor-mediated phagocytic ability of THP1 cells. In bone marrow-derived macrophages, SLAT protein is recruited to the early phagosomes formed via Fcgamma receptor engagement. SLAT recruitment to the phagosome was most efficient when the macrophages express at least one isoform of Rac (Rac1 or Rac2), because SLAT recruitment was reduced in macrophages of Rac-deficient mice. Macrophages derived from animals lacking SLAT show an elevation in the rate of Fcgamma receptor-mediated phagocytosis. The absence of SLAT is associated with an increase in the amount of F-actin formed around these phagosomes as well as an increase in the amount of Rac1 protein recruited to the phagosome. Our results suggest that SLAT acts as a gatekeeper for the amount of Rac recruited to the phagosomes formed by Fcgamma receptor engagement and thus is able to regulate F-actin re-organization and consequently phagocytosis.
Figures


Similar articles
-
SWAP-70-like adapter of T cells: a novel Lck-regulated guanine nucleotide exchange factor coordinating actin cytoskeleton reorganization and Ca2+ signaling in T cells.Immunol Rev. 2009 Nov;232(1):319-33. doi: 10.1111/j.1600-065X.2009.00839.x. Immunol Rev. 2009. PMID: 19909373 Free PMC article. Review.
-
Cdc42, Rac1, and Rac2 display distinct patterns of activation during phagocytosis.Mol Biol Cell. 2004 Aug;15(8):3509-19. doi: 10.1091/mbc.e03-11-0847. Epub 2004 May 28. Mol Biol Cell. 2004. PMID: 15169870 Free PMC article.
-
Vav regulates activation of Rac but not Cdc42 during FcgammaR-mediated phagocytosis.Mol Biol Cell. 2002 Apr;13(4):1215-26. doi: 10.1091/mbc.02-01-0002. Mol Biol Cell. 2002. PMID: 11950933 Free PMC article.
-
Integrin beta 1 regulates phagosome maturation in macrophages through Rac expression.J Immunol. 2008 Feb 15;180(4):2419-28. doi: 10.4049/jimmunol.180.4.2419. J Immunol. 2008. PMID: 18250451
-
Phagocytosis and the actin cytoskeleton.J Cell Sci. 2001 Mar;114(Pt 6):1061-77. doi: 10.1242/jcs.114.6.1061. J Cell Sci. 2001. PMID: 11228151 Review.
Cited by
-
Identification of a Novel Alternatively Spliced Form of Inflammatory Regulator SWAP-70-Like Adapter of T Cells.Int J Inflam. 2017;2017:1324735. doi: 10.1155/2017/1324735. Epub 2017 Apr 24. Int J Inflam. 2017. PMID: 28523202 Free PMC article.
-
IFN-α and lipopolysaccharide upregulate APOBEC3 mRNA through different signaling pathways.J Immunol. 2012 Oct 15;189(8):4088-103. doi: 10.4049/jimmunol.1200777. Epub 2012 Sep 12. J Immunol. 2012. PMID: 22972924 Free PMC article.
-
Human DEF6 deficiency underlies an immunodeficiency syndrome with systemic autoimmunity and aberrant CTLA-4 homeostasis.Nat Commun. 2019 Jul 15;10(1):3106. doi: 10.1038/s41467-019-10812-x. Nat Commun. 2019. PMID: 31308374 Free PMC article.
-
SWAP-70-like adapter of T cells: a novel Lck-regulated guanine nucleotide exchange factor coordinating actin cytoskeleton reorganization and Ca2+ signaling in T cells.Immunol Rev. 2009 Nov;232(1):319-33. doi: 10.1111/j.1600-065X.2009.00839.x. Immunol Rev. 2009. PMID: 19909373 Free PMC article. Review.
-
DEF6 expression in ovarian carcinoma correlates with poor patient survival.Diagn Pathol. 2016 Aug 3;11(1):68. doi: 10.1186/s13000-016-0518-y. Diagn Pathol. 2016. PMID: 27488395 Free PMC article.
References
-
- Coppolino, M. G., Krause, M., Hagendorff, P., Monner, D. A., Trimble, W., Grinstein, S., Wehland, J., and Sechi, A. S. (2001) J. Cell Sci. 114 4307–4318 - PubMed
-
- Bouvier, G., Benoliel, A. M., Foa, C., and Bongrand, P. (1994) J. Leukocyte Biol. 55 729–734 - PubMed
-
- Niedergang, F., and Chavrier, P. (2004) Curr. Opin. Cell Biol. 16 422–428 - PubMed
-
- Lucas, M., Zhang, X., Prasanna, V., and Mosser, D. M. (2005) J. Immunol. 175 469–477 - PubMed
Publication types
MeSH terms
Substances
Grants and funding
LinkOut - more resources
Full Text Sources
Molecular Biology Databases
Research Materials
Miscellaneous
