. 2009 May;191(10):3226-36.
doi: 10.1128/JB.01410-08. Epub 2009 Feb 27.

Similar and divergent effects of ppGpp and DksA deficiencies on transcription in Escherichia coli

Affiliations

Similar and divergent effects of ppGpp and DksA deficiencies on transcription in Escherichia coli

Anna Aberg et al. J Bacteriol. 2009 May.

Abstract

The concerted action of ppGpp and DksA in transcription has been widely documented. In disparity with this model, phenotypic studies showed that ppGpp and DksA might also have independent and opposing roles in gene expression in Escherichia coli. In this study we used a transcriptomic approach to compare the global transcriptional patterns of gene expression in strains deficient in ppGpp (ppGpp(0)) and/or DksA (DeltadksA). Approximately 6 and 7% of all genes were significantly affected by more than twofold in ppGpp- and DksA-deficient strains, respectively, increasing to 13% of all genes in the ppGpp(0) DeltadksA strain. Although the data indicate that most of the affected genes were copositively or conegatively regulated by ppGpp and DksA, some genes that were independently and/or differentially regulated by the two factors were found. The large functional group of chemotaxis and flagellum synthesis genes were notably differentially affected, with all genes being upregulated in the DksA-deficient strain but 60% of them being downregulated in the ppGpp-deficient strain. Revealingly, mutations in the antipausing Gre factors suppress the upregulation observed in the DksA-deficient strain, emphasizing the importance of the secondary channel of the RNA polymerase for regulation and fine-tuning of gene expression in E. coli.


Figures

FIG. 1.
FIG. 1.
Experimental setup and validation of the microarray data. (A) Schematic illustration of the experimental layout used in this microarray study. cDNAs from the WT (MG1655), ppGpp0 (CF1693), ΔdksA (AAG95), and ppGpp0 ΔdksA (AAG98) strains, labeled with either Cy3 or Cy5, were hybridized to microarray slides in the different combinations shown. The origins of the arrows show the Cy3-labeled samples, whereas the destinations show the Cy5-labeled samples. The number on the arrow shows the number of replicates for each combination. (B) Statistical MA plots of the normalized raw data obtained from each WT/mutant comparison. M represents the fold change in gene expression between WT and mutant (log2 values), and A represents the average spot intensity. (C) RT-PCR analysis of transcription of 10 selected genes from the WT (MG1655), ppGpp0 (CF1693), ΔdksA (AAG95), and ppGpp0 ΔdksA (AAG98) strains. The amounts of total RNA used as the template were 10 ng for tnaA; 20 ng for hns, ompT, and uspA; 40 ng for fadL; 200 ng for flu, flhD, fliC, and fimA; and 400 ng for fliA. hns was included as a control to confirm that equivalent amounts of template were used. Samples from bacterial cultures grown in LB medium to an OD600 of 1.5 at 37°C were used for all the studies shown.
FIG. 2.
FIG. 2.
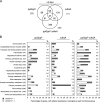
Effect of ppGpp and/or DksA deficiency on global gene expression pattern in E. coli. (A) Venn diagram representing the number of ORFs with altered expression levels (more than twofold) in the different mutant strains (ppGpp0 [CF1693], ΔdksA [AAG95], and ppGpp0 ΔdksA [AAG98]) compared to the WT (MG1655). Numbers in gray indicate the total number of ORFs that were altered in each mutant strain in comparison to the WT (P < 0.0001). (B) Distribution of the ORFs with more than twofold-altered expression into functional categories. The bar diagram represents the percentage of ORFs with altered expression relative to the total number of ORFs in each functional group. The open bars represent the percentage of ORFs having decreased expression compared to the WT (M value of <−1). The gray bars represent the percentage of ORFs with elevated expression in the mutant compared to the WT (M value of >1). The total number of ORFs present in each category in E. coli is indicated in parentheses after the category designation. The numbers besides the bar diagrams represent the percentage of ORFs affected in each functional category relative to the total number of ORFs affected in each mutant strain (265, 311, and 556 ORFs in the ppGpp0, ΔdksA, and ppGpp0 ΔdksA strains, respectively).
FIG. 3.
FIG. 3.
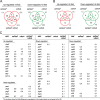
General pattern of transcription stimulation and repression in strains deficient in ppGpp and/or DksA. (A and B) The Venn diagrams indicate the number of ORFs upregulated (red) and downregulated (green) more than either twofold (A) or sixfold (B) in the different mutant strains. ORFs that were differentially altered in one of the mutant strains compared to the others have been excluded. (C) Table showing the 63 (49 + 14) ORFs affected more than sixfold in the ppGpp0 ΔdksA strain compared to the WT and the fold difference in expression of each ORF in the three mutant strains compared to the WT (P < 0.0001). The absence of number indicates no significant difference in expression level compared to the WT strain.
FIG. 4.
FIG. 4.
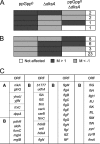
Expression profiles of the ORFs altered more than twofold compared to the WT and differentially regulated in at least one of the mutant strains (P < 0.0001). Dark and light gray boxes indicate upregulation (M value of >1) or downregulation (M value of <−1) of gene expression in the mutant strains, respectively. White boxes indicate no significant alteration of gene expression. The number of ORFs found in each “class” is shown on the right. (A) ORFs presumably repressed by ppGpp (upregulated in the ppGpp-deficient strain). (B) ORFs presumably stimulated by ppGpp (downregulated in the ppGpp-deficient strain). (C) Table showing the names of the ORFs represented in the different “classes” represented in panels A and B. Genes are listed following the subclasses in panels A and B from top to bottom.
FIG. 5.
FIG. 5.
Effect of ppGpp and/or DksA deficiencies on flagellum biosynthesis and chemotaxis in E. coli. (A) Genetic structure of the genes involved in flagellum biosynthesis and chemotaxis. Marked lines indicate whether the operons are expressed in the early (white), middle (gray), or late (black) stage of the temporal induction pathway. Dashed-arrow lines indicate promoters that are σ70 dependent and solid arrow lines promoters that are σF dependent. The numbers below the ORF names show the fold difference in transcriptional expression in each mutant (ppGpp0 [CF1693], ΔdksA [AAG95], and ppGpp0 ΔdksA [AAG98)]) compared to the WT (MG1655). Downregulated genes have values of <1, and upregulated genes have values of >1 (P < 0.0001) (B) Determination of the effect of ppGpp and/or DksA on motility. Movement on low-agar TB plates containing three chemoattractants (l-serine, maltose, and glucose) and one chemorepellent (l-valine) was measured for the WT (MG1655), ppGpp0 (CF1693), ΔdksA (AAG95), and ppGpp0 ΔdksA (AAG98) strains. The diameter of the perimeter of the bacterial growth was measured, and averages and standard errors from four independent experiments were plotted in the graphs to the left of the pictures.
FIG. 6.
FIG. 6.
ppGpp and DksA deficiencies differentially affect flagellum production. (A) Electron micrographs of bacterial cultures of the WT (MG1655), ppGpp0 (CF1693), ΔdksA (AAG95), and ppGpp0 ΔdksA (JVF14) strains, grown under the same conditions as for Fig. 1. Bar, 5 μm. (B) Effect of ppGpp and DksA deficiencies on expression of the major flagellum subunit FliC and the sigma subunit FliA. Determinations of the protein levels of FliC, FliA, and H-NS (control) were performed by Western blot analysis of protein extracts from the WT (MG1655), ppGpp0 (CF1693), ΔdksA (AAG95), and ppGpp0 ΔdksA (AAG98) strains cultured as for Fig. 1. For FliC and FliA immunodetection, 100 μg of protein extracts was used for the WT and ppGpp0 strains, while 5 μg of the ΔdksA extract and 10 μg of the ppGpp0 ΔdksA extract were used. For H-NS detection, 25 μg of each extract was used. The values shown below the gels represent the relative amount of protein found in the mutant strains compared to the WT strain (set as 1), after adjusting for the amount of extract used.
FIG. 7.
FIG. 7.
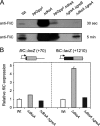
GreA and GreB regulate expression of the major flagellum subunit FliC. (A) FliC immunodetection in protein extracts (100 μg) from the WT (MG1655), ppGpp0 (CF1693), ΔdksA (AAG95), ppGpp0 ΔdksA (AAG98), ΔgreA ΔgreB (AAG107), and ΔdksA ΔgreA (AAG101) strains cultured as for Fig. 1. Detection after 30 s and 5 min of exposure is shown. (B) Expression from two chromosomal fliC::lacZ transcriptional fusions. lacZ fusions within the fliC gene at positions +70 (left panel) and +1210 (right panel) were constructed, and their expression in the WT (PRG13 and PRG16), ΔdksA (PRG14 and PRG17), and ΔdksA ΔgreA (PRG15 and PRG18) strains was monitored. Cultures were grown in LB medium to an OD600 of 1.5 at 37°C. Relative average values and standard deviations from three independent experiments are shown. For each fliC::lacZ fusion, the value in Miller units in the WT was set as 1, which corresponds to 60 and 106 Miller units for PRG13 and PRG16, respectively.

References

    1. Aberg, A., V. Shingler, and C. Balsalobre. 2006. (p) ppGpp regulates type 1 fimbriation of Escherichia coli by modulating the expression of the site-specific recombinase FimB. Mol. Microbiol. 601520-1533. - PubMed
    1. Aberg, A., V. Shingler, and C. Balsalobre. 2008. Regulation of the fimB promoter: a case of differential regulation by ppGpp and DksA in vivo. Mol. Microbiol. 671223-1241. - PubMed
    1. Bertani, G. 1951. Studies on lysogenesis. I. The mode of phage liberation by lysogenic Escherichia coli. J. Bacteriol. 63293-300. - PMC - PubMed
    1. Bradley, M. D., M. B. Beach, A. P. de Koning, T. S. Pratt, and R. Osuna. 2007. Effects of Fis on Escherichia coli gene expression during different growth stages. Microbiology 1532922-2940. - PubMed
    1. Braeken, K., M. Moris, R. Daniels, J. Vanderleyden, and J. Michiels. 2006. New horizons for (p) ppGpp in bacterial and plant physiology. Trends Microbiol. 1445-54. - PubMed

Publication types

MeSH terms

Substances