. 2009 Apr;41(4):438-45.
doi: 10.1038/ng.324. Epub 2009 Mar 1.

Gene expression divergence in yeast is coupled to evolution of DNA-encoded nucleosome organization

Affiliations

Gene expression divergence in yeast is coupled to evolution of DNA-encoded nucleosome organization

Yair Field et al. Nat Genet. 2009 Apr.

Abstract

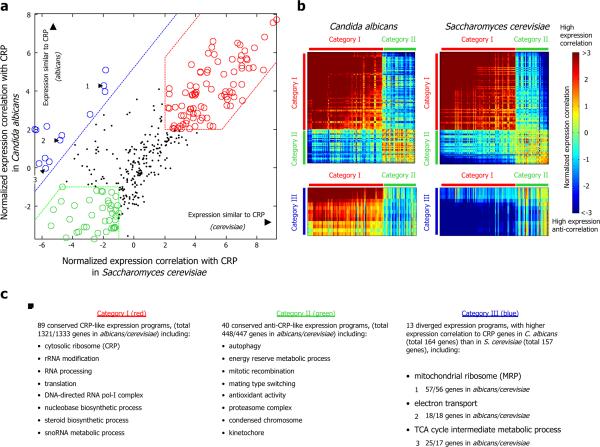
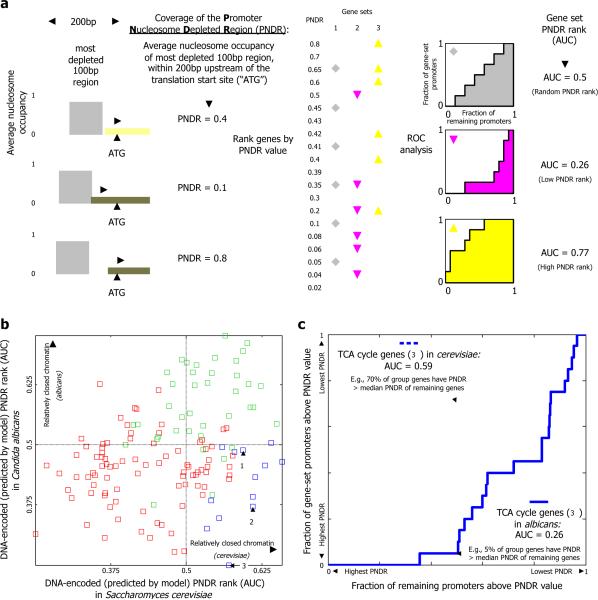
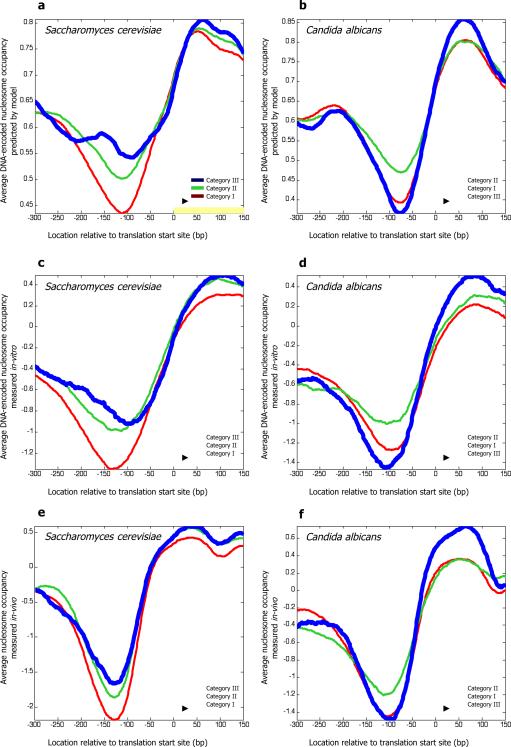
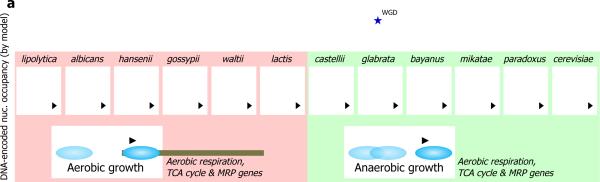
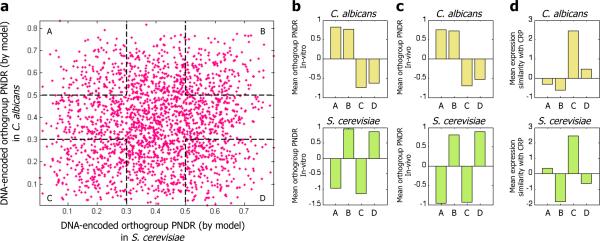
Eukaryotic transcription occurs within a chromatin environment, whose organization has an important regulatory function and is partly encoded in cis by the DNA sequence itself. Here, we examine whether evolutionary changes in gene expression are linked to changes in the DNA-encoded nucleosome organization of promoters. We find that in aerobic yeast species, where cellular respiration genes are active under typical growth conditions, the promoter sequences of these genes encode a relatively open (nucleosome-depleted) chromatin organization. This nucleosome-depleted organization requires only DNA sequence information, is independent of any cofactors and of transcription, and is a general property of growth-related genes. In contrast, in anaerobic yeast species, where cellular respiration genes are relatively inactive under typical growth conditions, respiration gene promoters encode relatively closed (nucleosome-occupied) chromatin organizations. Our results suggest a previously unidentified genetic mechanism underlying phenotypic diversity, consisting of DNA sequence changes that directly alter the DNA-encoded nucleosome organization of promoters.


Figures

Figure 1
Figure 1. S. cerevisiae and C. albicans exhibit large-scale changes in the transcriptional programs of cellular respiration and mitochondrial function genes
(a) For gene sets from Gene Ontology, shown is the average normalized Pearson correlation (see Methods) between the expression of their member genes and the expression of the cytosolic ribosomal proteins (CRP), computed separately for the expression compendia of C. albicans (y-axis) and S. cerevisiae (x-axis). Only gene sets that exhibit coherent co-expression in both species are shown, where we define coherently co-expressed gene sets as those in which the average normalized correlation between its member genes is above 0.5. From these gene set expression correlation measures, we define three categories of gene sets (category I, red, high correlation with CRP genes in both species; category II, green, anti-correlation with CRP genes in both species; and category III, blue, higher correlation with CRP genes in C. albicans than in S. cerevisiae. Three gene sets from category III are numbered for reference in other figures. (b) Shown are the normalized expression correlations, computed as in (a), between every pair of gene sets from all three categories defined in (a). Note the expression divergence of gene sets from category III (blue), which exhibit strong expression correlation with category I gene sets from C. albicans, but strong anti-correlation with category I gene sets from S. cerevisiae. (c) A subset of the list of gene sets in each of the categories defined in (a), along with the number of gene sets and number of genes in each category. More details are given for the three numbered categories from (a). See Table S1 or the full list.
Figure 2
Figure 2. The expression divergence of cellular respiration genes is accompanied by changes in the DNA-encoded nucleosome organization of their promoters
(a) A toy example illustrating the rank statistic used to assess whether the DNA-encoded nucleosome organization of promoters of a given gene set encode a relatively open or relatively closed organization. For each gene, we use the model of the nucleosome sequence preferences to compute the DNA-encoded nucleosome coverage over the nucleosome depleted region of its promoter (left, termed PNDR), and rank all genes by these PNDR scores (middle table, values were arbitrarily chosen for illustration). The rank statistic of each gene set is then obtained by computing the area under the curve (AUC) in a graph that plots the fraction of promoters from the gene set (y-axis) that are above a certain PNDR score versus the fraction of all other promoters above that PNDR score, for all possible PNDR values (three plots on right-end). Plots for three sample gene sets are shown: a gene set with a random AUC rank of 0.5 (top, gray); a gene set whose genes have relatively open nucleosome organizations and thus relatively low PNDR scores (middle, pink); and a gene set whose genes have relatively closed nucleosome organizations and thus relatively high PNDR scores (bottom, yellow). (b) For every gene set from the three categories defined in Fig. 1a, shown are its PNDR rank statistic, computed as explained in (a), in both C. albicans (y-axis) and S. cerevisiae. Gene sets from each category are colored as in Fig. 1a. The three numbered gene sets from category III in Fig. 1a are numbered here as well. (c) Example of an AUC plot for one of the gene sets from (b) (the TCA cycle gene set), in both S. cerevisiae (dashed line), and C. albicans (full line). The promoters of the gene set in this example have relatively high PNDR scores in S. cerevisiae and thus encode relatively closed nucleosome organizations, whereas in C. albicans, they have relatively low PNDR scores and thus encode relatively open nucleosome organizations. For example, only ~5% of the gene sets' promoters have higher PNDR scores than the PNDR score which is exceeded by ~50% of the promoters in C. albicans.
Figure 3
Figure 3. The DNA-encoded nucleosome organization of cellular respiration promoters has diverged between S. cerevisiae and C. albicans
(a) For each of the three categories defined in Fig. 1a, we created a single gene set per category that consists of all genes from all gene sets of that category. Shown is the average nucleosome occupancy in S. cerevisiae, predicted by our sequence-based model of nucleosome sequence preferences, across this unionized gene set per category. Average occupancy profiles are shown relative to the translation start site of the corresponding genes (we used translation start sites since transcription start sites are not well-annotated genome-wide for C. albicans). (b) Same as (a), but for C. albicans. (c) Same as (a), but using the in vitro map of nucleosome occupancy that we measured in S. cerevisiae. (d) Same as (c), but for C. albicans. (e) Same as (a), but using the in vivo map of nucleosome positions that we measured in S. cerevisiae. (f) Same as (e), but for C. albicans.
Figure 4
Figure 4. The emergence of anaerobic yeast species coincides with an evolutionary change in the DNA-encoded nucleosome organization of cellular respiration promoters
Shown is the average nucleosome occupancy, predicted by our model of nucleosome sequence preferences, across all genes from each of the three categories of gene sets defined in Fig. 1a, for each of 12 different yeast species whose genomic sequence is available. Average nucleosome occupancy profiles are shown relative to the translation start site of the corresponding genes in each species, color-coded as in Fig. 3. Yeast species are organized according to their phylogenetic tree, aerobic and anaerobic yeast species are indicated by pink (left) and green (right) boxes, respectively, and the point in evolution where the apparent whole-genome duplication event has occurred is indicated (blue asterisk). Note that in all of the aerobic yeast species, promoters of category III genes encode a relatively more open nucleosome organization compared to promoters of category II genes, while in all of the anaerobic yeast species, the situation is reversed, and promoters of category III genes encode a relatively more closed nucleosome organization compared to promoters of category II genes.
Figure 5
Figure 5. A global relationship between evolutionary changes in the DNA-encoded nucleosome organization and evolutionary changes in expression
(a) Shown is the PNDR score predicted by our model of nucleosome sequence preferences, for each ortholog from C. albicans (y-axis) and S. cerevisiae (x-axis). For orthologs that contain more than one gene in one of the species, the average PNDR score is shown. We used this plot to define four groups (“A”, “B”, “C”, and “D”), for all combinations of high (above 0.5) and low (below 0.3) PNDR scores in the two species. (b) For each of the four groups defined in (a), shown are the PNDR scores computed from the in vitro nucleosome occupancy map in C. albicans (top) and S. cerevisiae (bottom). PNDR scores are shown as the difference between the actual PNDR score of the gene group and the average PNDR score of all genes in each respective species. Note that for all groups, high and low PNDR scores predicted by the model in each species have correspondingly high and low PNDR scores in the in vitro maps, respectively. (c) Same as (b), when computing the PNDR scores using the in vivo nucleosome occupancy maps in C. albicans (top) and S. cerevisiae (bottom). Here too, for all groups, the model predictions are upheld in the in vivo nucleosome maps in each species. (d) For each of the four groups from (a), shown is the average normalized correlation between the expression of the genes from the group and the expression of the CRP genes in C. albicans (top) and S. cerevisiae (bottom).

References

    1. Segal E, et al. A genomic code for nucleosome positioning. Nature. 2006;442:772–8. - PMC - PubMed
    1. Ioshikhes IP, Albert I, Zanton SJ, Pugh BF. Nucleosome positions predicted through comparative genomics. Nat Genet. 2006;38:1210–5. - PubMed
    1. Peckham HE, et al. Nucleosome positioning signals in genomic DNA. Genome Res. 2007;17:1170–7. - PMC - PubMed
    1. Lee W, et al. A high-resolution atlas of nucleosome occupancy in yeast. Nat Genet. 2007;39:1235–44. - PubMed
    1. Yuan GC, Liu JS. Genomic sequence is highly predictive of local nucleosome depletion. PLoS Comput Biol. 2008;4:e13. - PMC - PubMed

Publication types