. 2009 Apr;10(4):375-84.
doi: 10.1038/ni.1704. Epub 2009 Mar 1.

The function of follicular helper T cells is regulated by the strength of T cell antigen receptor binding

Affiliations

The function of follicular helper T cells is regulated by the strength of T cell antigen receptor binding

Nicolas Fazilleau et al. Nat Immunol. 2009 Apr.

Abstract

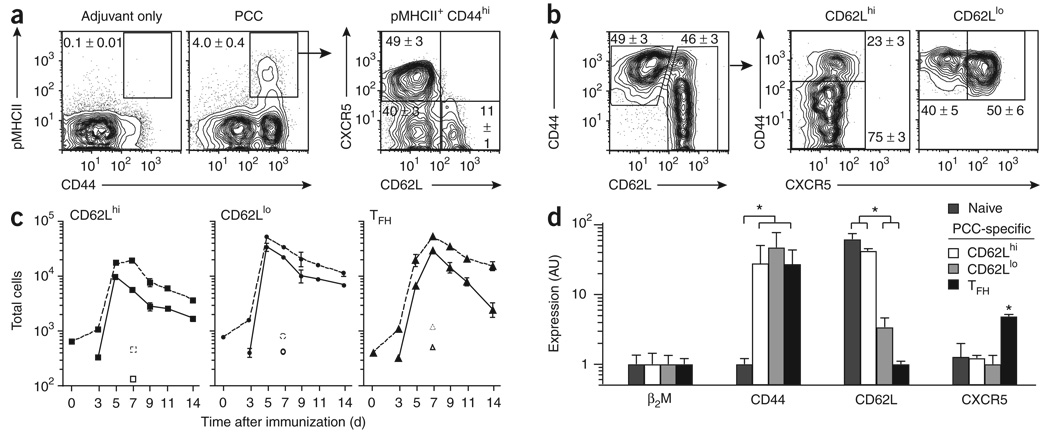
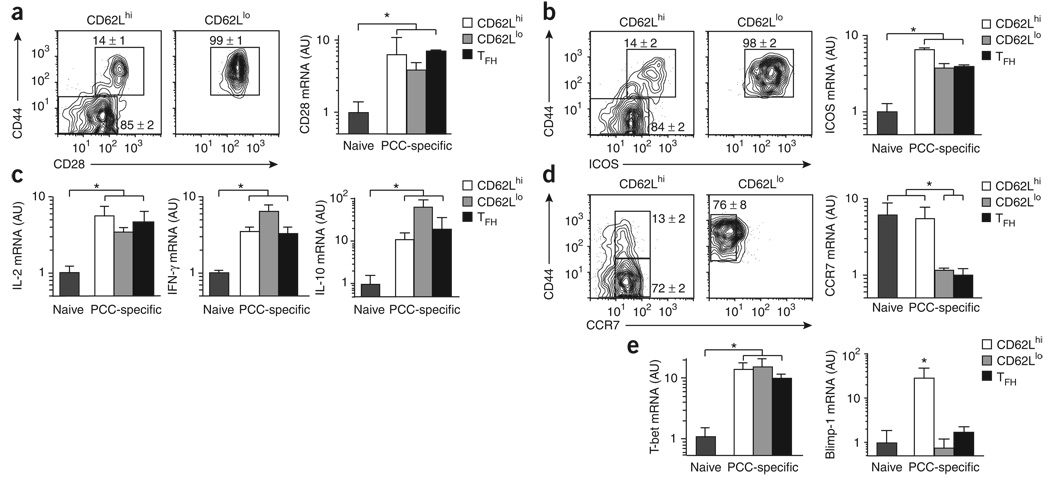
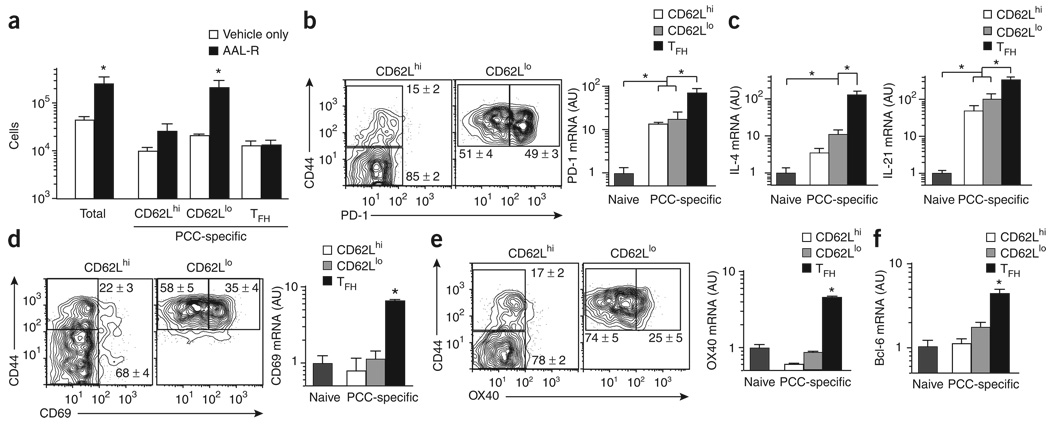
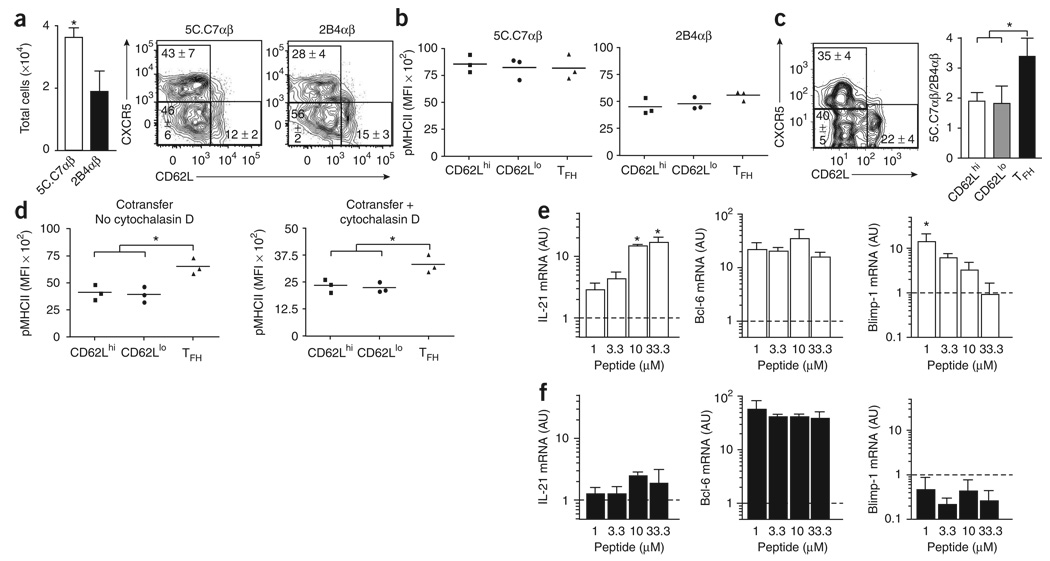
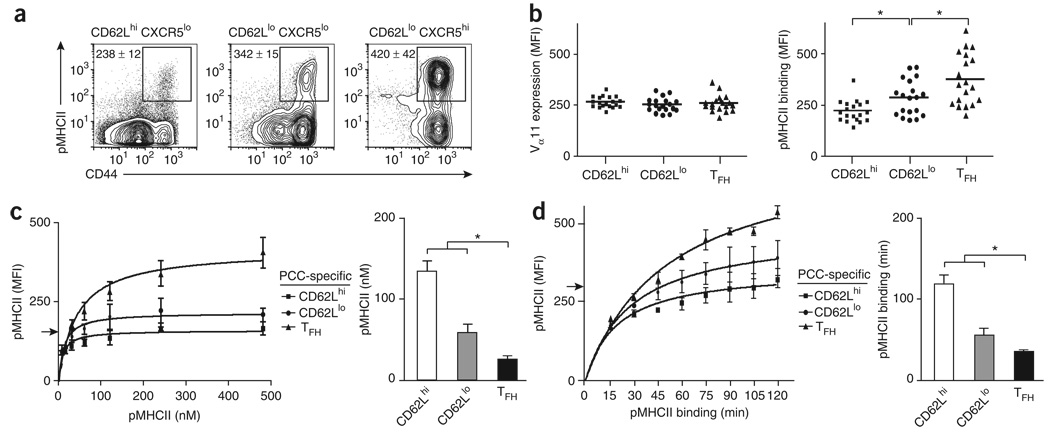
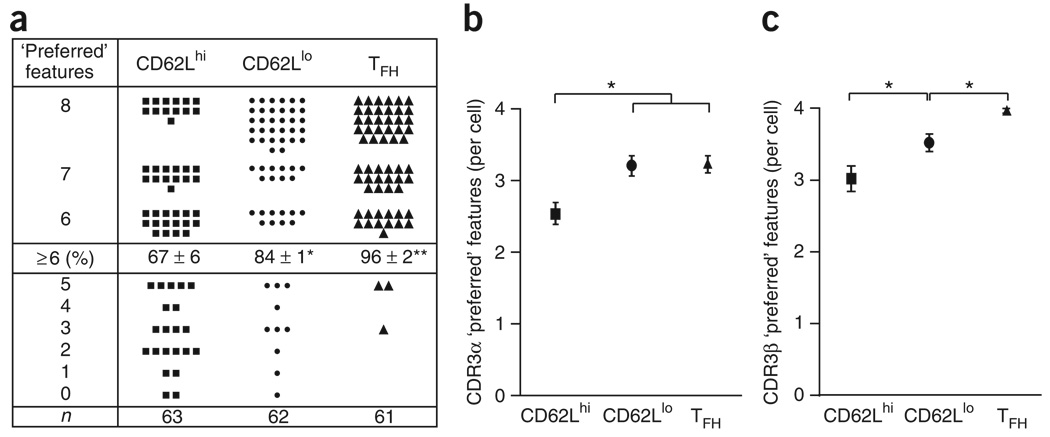
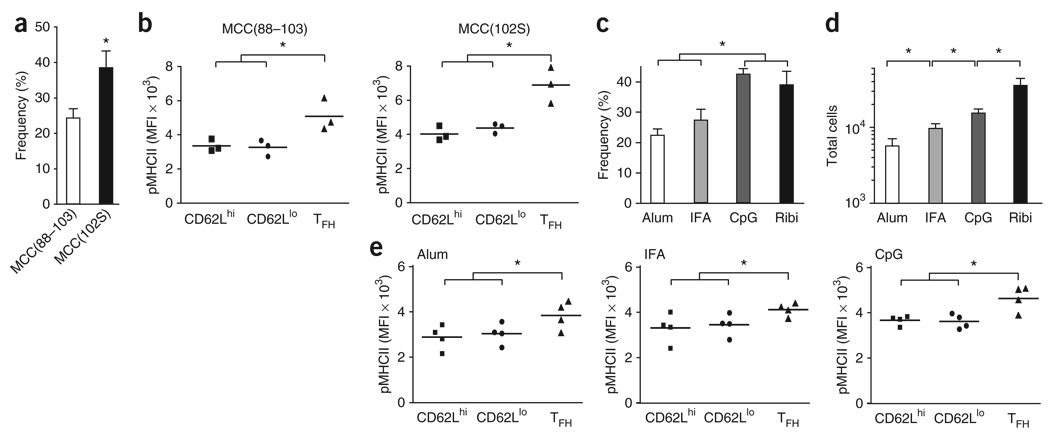
How follicular helper T cells (T(FH) cells) differentiate to regulate B cell immunity is critical for effective protein vaccination. Here we define three transcription factor T-bet-expressing antigen-specific effector helper T cell subsets with distinguishable function, migratory properties and developmental programming in vivo. Expression of the transcriptional repressor Blimp-1 distinguished T zone 'lymphoid' effector helper T cells (CD62L(hi)CCR7(hi)) from CXCR5(lo) 'emigrant' effector helper T cells and CXCR5(hi) 'resident' T(FH) cells expressing the transcriptional repressor Bcl-6 (CD62L(lo)CCR7(lo)). We then show by adoptive transfer and intact polyclonal responses that helper T cells with the highest specific binding of peptide-major histocompatibility complex class II and the most restricted T cell antigen receptor junctional diversity 'preferentially' developed into the antigen-specific effector T(FH) compartment. Our studies demonstrate a central function for differences in the binding strength of the T cell antigen receptor in the antigen-specific mechanisms that 'program' specialized effector T(FH) function in vivo.


Figures

Figure 1
Figure 1. Three subsets of antigen-specific effector helper T cells emerge in draining lymph nodes
(a,b) Expression of CD62L and CXCR5 (a) or CD44 and CXCR5 (b) on the surface of cells from draining lymph nodes (inguinal and periaortic) of B10.BR mice (n ≥ 6) 7 d after priming with PCC (a,b) or adjuvant only (a). (a) PCC-specific effector helper T cells (propidium iodide-negative (PI), B220CD8CD11bVα11+pMHCII+CD44hi). (b) Helper T cells (PIB220CD8CD11bVα11+Vβ3+, and either CD62Lhi or CD62Llo). Numbers adjacent to outlined areas or in quadrants indicate percent cells in each (mean ± s.e.m.). (c) Total PCC-specific Vα11+Vβ3+CD44hi (dashed lines) or Vα11+pMHCII+CD44hi (solid lines) effector helper T cells over time in draining lymph nodes after PCC priming (n ≥ 3 mice for each time point). Open symbols indicate estimate of total cells from B10.BR mice 7 d after adjuvant-only priming. (d) Expression of mRNA immediately after the isolation of 2 × 10³ naive helper T cells (Vα11+Vβ3+CD44loCD62Lhi) or PCC-specific helper T cells (Vα11+Vβ3+CD44hi) from lymph nodes on day 7 after subcutaneous priming (n = 3 mice). Estimates are presented in arbitrary units (AU) relative to β2-microglobulin mRNA (β2M), set as 1. PCC-specific: CD62Lhi, CD62LhiCXCR5lo; CD62Llo, CD62LloCXCR5lo; TFH, CD62LloCXCR5hi. *, P ≤ 0.05 (unpaired Student's t-test). Data are representative of at least three experiments.
Figure 2
Figure 2. Lymphoid effector helper T cells express Blimp-1
(a,b) Left, expression of CD44 and either CD28 (a) or ICOS (b) on the surface of cells (PICD8CD11bB220Vα11+Vβ3+, and either CD62Lhi or CD62Llo), as described in Figure 1b from B10.BR mice on day 7 after PCC priming (n ≥ 4 mice). Numbers adjacent to outlined areas indicate percent cells in each (mean ± s.e.m.). Far right, expression CD28 mRNA (a) or ICOS mRNA (b) immediately after isolation of 2 × 10³ naive helper T cells or PCC-specific helper T cell subsets (as described in Fig. 1d) from lymph nodes on day 7 after priming. (c) Expression of IL-2, IFN-γ and IL-10 mRNA, analyzed as described in Figure 1d. (d) Expression of CD44 and CCR7, analyzed as described in Figure 1d. (e) Expression of T-bet and Blimp-1 mRNA, analyzed as described in Figure 1d. Estimates for mRNA are presented in arbitrary units (mean and s.e.m.) relative to results obtained for naive cells, set as 1 (n = 3 mice). *, P ≤ 0.05 (unpaired Student's t-test). Data are representative of three experiments.
Figure 3
Figure 3. ‘Resident’ effector TFH cells express Bcl-6
(a) Total PCC-specific effector helper T cells (Vα11+Vβ3+CD44hi) and PCC-specific effector helper T cell subsets (horizontal axis, as described for Fig. 1d key) from lymph nodes on day 7 after priming of mice (n = 3) treated with AAL-R or vehicle only (mean and s.e.m.). (b) Left, expression of CD44 and PD-1 on the surface of lymph node cells (CD8CD11bB220PIVα11+Vβ3+ and either CD62Lhi or CD62Llo) from B10.BR mice on day 7 after PCC priming (n ≥ 4 mice). Far right, expression PD-1 mRNA immediately after isolation of 2 × 10³ naive helper T cells or PCC-specific helper T cell subsets (as described in Fig. 1d) from lymph nodes on day 7 after priming, (c) Expression of IL-4 and IL-21 mRNA, analyzed as described in Figure 1d. (d,e) Expression of CD44 and either CD69 (d) or 0X40 (e) on the surface of lymph node cells (left), and CD69 mRNA (d, right) or 0X40 mRNA (e, right), analyzed as described in Figure 1d. (f) Expression of Bcl-6 mRNA, analyzed as described in Figure 1d. Numbers adjacent to outlined areas (b,d,e) indicate percent cells in each (mean ± s.e.m.). Results for mRNA (b,d,e, far right; c,f) are presented in arbitrary units (mean and s.e.m.) relative to results obtained for naive cells, set as 1 (n ≥ 3 mice). *, P ≤ 0.05 (unpaired Student's t-test). Data are representative of at least three experiments.
Figure 4
Figure 4. Precursors with high-affinity TCR ‘preferentially’ develop into ‘resident’ TFH cells
(a) Left, total PCC-specific transgenic effector helper T cells (PIB220CD8CD11bVβ3+CD90.2+CD44hi) in CD90.1 hosts given 1 × 10⁴ syngeneic naive PCC-specific 2B4 or 5C.C7 TCRαβ-transgenic helper T splenocytes (CD4+Vα11+Vβ3+CD44loCD62Lhi) and then immunized with PCC in Ribi (mean and s.e.m.; n = 3 mice). Right, CXCR5 and CD62L staining on the surface of PCC-specific transgenic effector helper T cells. Numbers in quadrants indicate percent cells in each (mean ± s.e.m.; n = 3 mice), (b) Staining of pMHCII tetramers for each transgenic effector helper T cell subset in a (all CD90.1Vα11+pMHC11+CD44hi; horizontal axis, as described for Fig. 1d key). Each symbol represents an individual mouse; small horizontal bars indicate the mean. (c) Left, CXCR5 and CD62L staining on the surface of PCC-specific transgenic effector helper T cells (PIB220CD8CD11bVβ3+CD90.22+CD44hi) from CD90.1 hosts given a mixture of 1 × 10⁴ syngeneic naive PCC-specific 2B4 and 5C.C7 TCRαβ-transgenic helper T splenocytes and then immunized with PCC in Ribi; cells are from lymph nodes obtained on day 7 after immunization. Numbers in quadrants indicate percent cells in each (mean ± s.e.m.; n = 3 mice). Right, single-cell RT-PCR analysis of the cell origin of 2B4αβ and 5C.C7β helper T cells among antigen-experienced PCC-specific transgenic helper T cells (all Vβ3+CD44hi CD90.2+; horizontal axis, as described for Fig. 1d key), assessed with Jβ2.5- and Jβ1.2-specific primers and presented as the ratio of total 5C.C7αβ-transgenic cells participating in the PCC response to 2B4αβ-transgenic cells in each effector helper T cell subset (mean and s.e.m.; n = 3). (d) Staining of pMHCII tetramers for each transgenic effector helper T cell subset (as described in b), assessed in the presence or absence of cytochalasin D. (e,f) Quantitative PCR analysis of IL-21, Bcl-6 and Blimp-1 mRNA from 5 × 10⁴ naive PCC-specific, 5C.C7 (e) or 2B4 (f) TCRαβ-transgenic helper T splenocytes (CD4+Vα11+Vβ3+CD44loCD62Lhi) cultured for 3 d in vitro in the presence of 5 × 10³ CD11c+ antigen-presenting cells loaded with various concentrations of MCC(88–103) (Peptide; horizontal axis). Results are presented in arbitrary units (mean and s.e.m.) relative to results obtained for naive cells (dashed lines), set as 1 (n = 3 mice for each peptide concentration). *, P ≤ 0.05 (unpaired Student's t-test). Data are representative of three experiments.
Figure 5
Figure 5. ‘Resident’ TFH cells have stronger pMHCII binding than do other effector helper T cells
(a) Expression of pMHCII and CD44 on the surface of helper T cell subsets (CD8CD11bB220prVα11+ and CD62LhiCXCR5lo, CD62LloCXCR5lo or CD62LloCXCR5hi) from lymph nodes on 7 d after PCC priming of mice. Numbers adjacent to outlined areas indicate MFI of each (mean ± s.e.m.; n ≥ 4 mice), (b) Vα11 expression and pMHCII tetramer staining for each PCC-specific effector helper T cell subset (all Vα11+pMHCII+CD44h; horizontal axis, as described for Fig. 1d key). Each symbol represents an individual mouse; small horizontal bars indicate the mean. *, P ≤ 0.01 (one-tail paired Student's t-test). (c,d) Left, pMHCII tetramer staining on the surface of PCC-specific helper T cell subsets (as in b; day 7 after priming) after staining with varying amounts of pMHCII tetramer (c) or with optimal pMHCII tetramer concentration but varying times of pMHCII tetramer binding (d). Right, pMHCII tetramer concentration required for each subset to reach an MFI of 150 (arrow at left; c) and time of pMHCII tetramer binding required for each subset to reach an MFI of 300 (arrow at left; d). Results presented as mean and s.e.m. (n = 3 mice for each condition). *, P ≤ 0.05 (unpaired Student's t-test). Data are representative of at least three experiments.
Figure 6
Figure 6. ‘Resident’ TFH cells express a more restricted TCR repertoire than do other effector helper T cells
Single-cell repertoire analysis of individual PCC-specific effector helper T cells (Vα11+Vβ3+CD44hi) for each subset (as described in Fig. 1d), (a) Each filled symbol represents the number of the following ‘preferred’ CDR3 features known to be selected in the PCC response for a single cell: CDR3α, glutamic acid at α93, serine at α95, eight amino acids, Jα16, Jα17, Jaα22 and Jα34; CDR3β, asparagine at β100, alanine or glycine at β102, nine amino acids, Jβ1.2 and Jβ2.5. Middle row: percent cells (± s.e.m.) with six or more ‘preferred’ features, expressing a restricted TCR of the dominant clonotype (among n = number of single cells used in the analysis (bottom row); three individual mice). *, P ≤ 0.05, and **, P ≤ 0.01 (unpaired Student's t-test). (b,c) ‘Preferred’ CDR3 features for one single cell of each subset for the TCRα chain (b) or TCRβ chain (c), presented as the mean ± s.e.m. *, P ≤ 0.05 (unpaired Student's t-test). Data are representative of three experiments.
Figure 7
Figure 7. ‘Resident’ TFH cells ‘preferentially’ develop after priming with adjuvants that promote highaffinity antigen-specific helper T cells
(a) Frequency of TFH cells (CD62LloCXCR5hi) among PCC-specific helper T cells (CD8CD11bB220PICD4+Vα11+Vβ3+CD44hi) from lymph nodes on day 7 after priming with MCC(88–103) or MCC(102S) in Ribi (mean ± s.e.m.; n = 3 mice). *, P ≤ 0.05 (unpaired Student's t-test). (b) Staining of pMHCII tetramers for each PCC-specific effector helper T cell subset (as in Fig. 5b) from the mice in a. *, P ≤ 0.05 (one-tail paired Student's t-test). (c,d) Frequency of TFH cells among PCC-specific helper T cells (c) or total PCC-specific TFH cells (d) from lymph nodes on day 7 after priming with PCC in alum, IFA, CpG or Ribi (mean and s.e.m.; n = 4 mice). *, P ≤ 0.05 (unpaired Student's t-test). (e) Staining of pMHCII tetramers for each PCC-specific effector helper T cell subset (as in Fig. 5b) from lymph nodes on day 7 after priming with PCC in alum, IFA or CpG. *, P ≤ 0.05 (one-tail paired Student's t-test). Data are representative of at least three experiments.

Similar articles

Cited by

References

    1. Fazilleau N, McHeyzer-Williams LJ, McHeyzer-Williams MG. Local development of effector and memory T helper cells. Curr. Opin. Immunol. 2007;19:259–267. - PubMed
    1. McHeyzer-Williams LJ, McHeyzer-Williams MG. Antigen-specific memory B cell development. Annu. Rev. Immunol. 2005;23:487–513. - PubMed
    1. King C, Tangye SG, Mackay CR. T follicular helper (TFH) cells in normal and dysregulated immune responses. Annu. Rev. Immunol. 2008;26:741–766. - PubMed
    1. Vinuesa CG, Tangye SG, Moser B, Mackay CR. Follicular B helper T cells in antibody responses and autoimmunity. Nat. Rev. Immunol. 2005;5:853–865. - PubMed
    1. Breitfeld D, et al. Follicular B helper T cells express CXC chemokine receptor 5, localize to B cell follicles, and support immunoglobulin production. J. Exp. Med. 2000;192:1545–1552. - PMC - PubMed

Publication types

MeSH terms