

doi: 10.1038/nn.2284.
Epub 2009 Mar 1.
Thalamic activity that drives visual cortical plasticity
Affiliations
- PMID: 19252494
- PMCID: PMC2669755
- DOI: 10.1038/nn.2284
Item in Clipboard
Thalamic activity that drives visual cortical plasticity
Nat Neurosci.
2009 Apr.
Abstract
Manipulations of activity in one retina can profoundly affect binocular connections in the visual cortex. Retinal activity is relayed to the cortex by the dorsal lateral geniculate nucleus (dLGN). We compared the qualities and amount of activity in the dLGN following monocular eyelid closure and monocular retinal inactivation in awake mice. Our findings substantially alter the interpretation of previous studies and define the afferent activity patterns that trigger cortical plasticity.
Figures
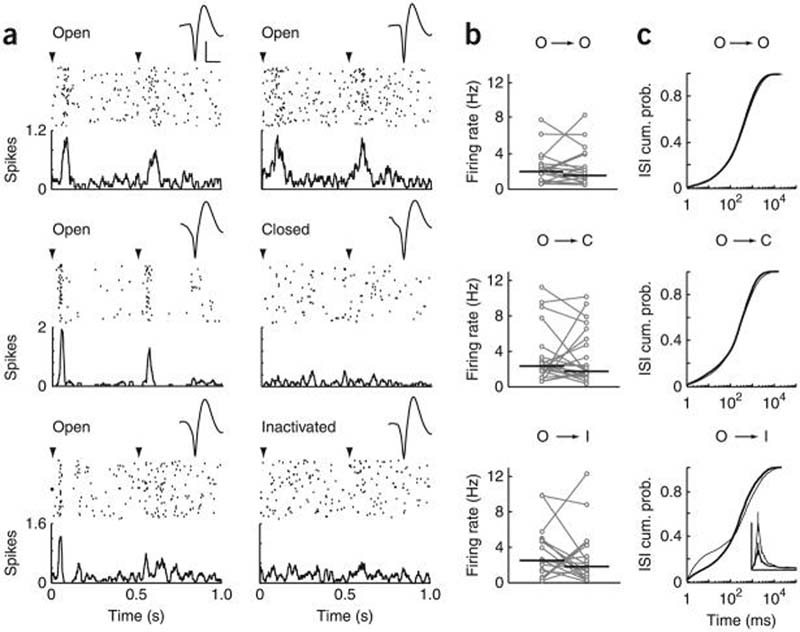
Firing rate and ISI distributions before and after visual manipulation. (a) Peristimulus time histograms and raster plots from representative neurons for each experimental group. Stimuli were presented at 0 or 90°, 1-Hz phase reversing. Arrowheads in this and subsequent figures indicate time of stimulus phase reversal. Spike waveforms are recording session averages. Scale bars represent 100 μV and 500 μs. Left, data were obtained during baseline. Right, data were obtained after eye manipulation. Top, control group; middle, monocular eyelid closure group; bottom, retinal inactivation group. (b) Firing rates (recording session average) for each neuron in each group. Connected circles represent the same neuron recorded before and after eye manipulation (O, open; C, closed; I, inactivated). Black lines indicate median values (control: n = 22 neurons (9 mice), P > 0.2 Wilcoxon sign-rank; eyelid closure: n = 24 neurons (12 mice), P > 0.3; retinal inactivation: n = 19 neurons (8 mice), P > 0.3). See Supplementary Figure 6 for similar results with natural visual stimuli. (c) ISI distributions during baseline (thick black line) and after eye manipulation (thin black line). Note that retinal inactivation increased the probability of observing short ISIs (P < 10−5). Inset, probability density function (y axis, 0–0.14; x axis, 0–20 ms); the curves differ significantly from 2–4 ms (P < 0.01, Wilcoxon sign-rank).

Analysis of bursting activity before and after visual manipulation. (a) Raster plots of 80 stimulus trials from representative neurons (those nearest the median) in each experimental group. Black squares represent spikes in bursts and gray squares represent non-burst spikes. (b) Bursting of a representative neuron 48 h after intraocular TTX injection (see also Supplementary Fig. 3). (c) Burst percentage for each neuron in each group. Connected circles represent the same neuron recorded before and after eye manipulation. Black lines indicate the median values (control: n = 22 neurons (9 mice), P > 0.7; eyelid closure: n = 24 neurons (12 mice), P > 0.2); retinal inactivation: n = 19 neurons (8 mice), P < 10−3 Wilcoxon sign-rank). (d) Burst percentage as a function of the duration of retinal inactivation. Circles represent individual neurons. Black lines indicate the median values. At 2, 24 and 48 h, the percentage of spikes in bursts was significantly different from both the baseline and recovery (120 h) time points (P < 0.05 for all comparisons, Mann-Whitney U test). The baseline and recovery time points were not significantly different (P > 0.7, Mann-Whitney U test), nor were the time points during retinal inactivation (P > 0.4 for all comparisons, Mann-Whitney U test). (e,f) Inactivation of the contralateral eye increased firing rate and bursting of neurons in the dLGN ipsilateral core (n = 9 neurons (4 mice), P < 0.02 and 0.01, respectively, Wilcoxon sign-rank). Data are presented as in c (see also Supplementary Fig. 4). (g,h) Neuronal firing rate and the percentage of spike in bursts decreased significantly after retinal inactivation in Nembutal-anesthetized mice (n = 9 neurons (3 mice), P < 0.05 and 0.03, respectively, Wilcoxon sign-rank).
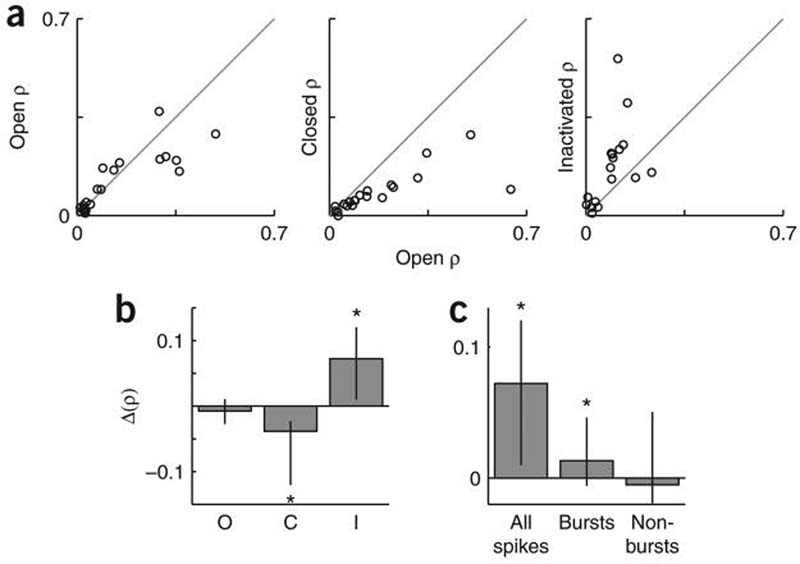
Eyelid closure and retinal inactivation have opposite effects on correlative dLGN firing. (a) Scatter plots of the area under the cross-correlogram from pairs of simultaneously recorded neurons before and after visual manipulation for each pair of simultaneously recorded neurons. Gray line represents unity. Note that nearly all points fall below the unity line following eyelid closure (center panel), indicating a decrease in correlative firing (ρ indicates correlation coefficient). (b) Eyelid closure and retinal inactivation had opposite effects on spike correlation (P < 10−4 Kruskal-Wallis test). Bars represent the median change in area under the peak of the cross-correlogram (±10 ms) following visual manipulation. Error bars show the interquartile range. Eyelid closure and retinal inactivation induced significant changes in correlation (control: n = 22 neuron pairs (6 mice), P > 0.2 Wilcoxon sign-rank; eyelid closure: n = 20 neuron pairs (6 mice), P < 10−3; retinal inactivation: n = 18 neuron pairs (6 mice), P < 0.01; see also Supplementary Fig. 6). (c) Bursts contributed to increased correlation following retinal inactivation. Data are represented as in b. The bursts group considered only the first spikes in each burst (n = 18 neuron pairs (6 mice), P < 0.03); the non-bursts group considered all spikes not contained in bursts (P > 0.9).
References
Publication types
MeSH terms
Substances
Grants and funding
LinkOut - more resources
Full Text Sources
Other Literature Sources
