. 2009 Apr;12(4):515-22.
doi: 10.1038/nn.2277. Epub 2009 Mar 1.

Hierarchical cognitive control deficits following damage to the human frontal lobe

Affiliations

Hierarchical cognitive control deficits following damage to the human frontal lobe

David Badre et al. Nat Neurosci. 2009 Apr.

Abstract

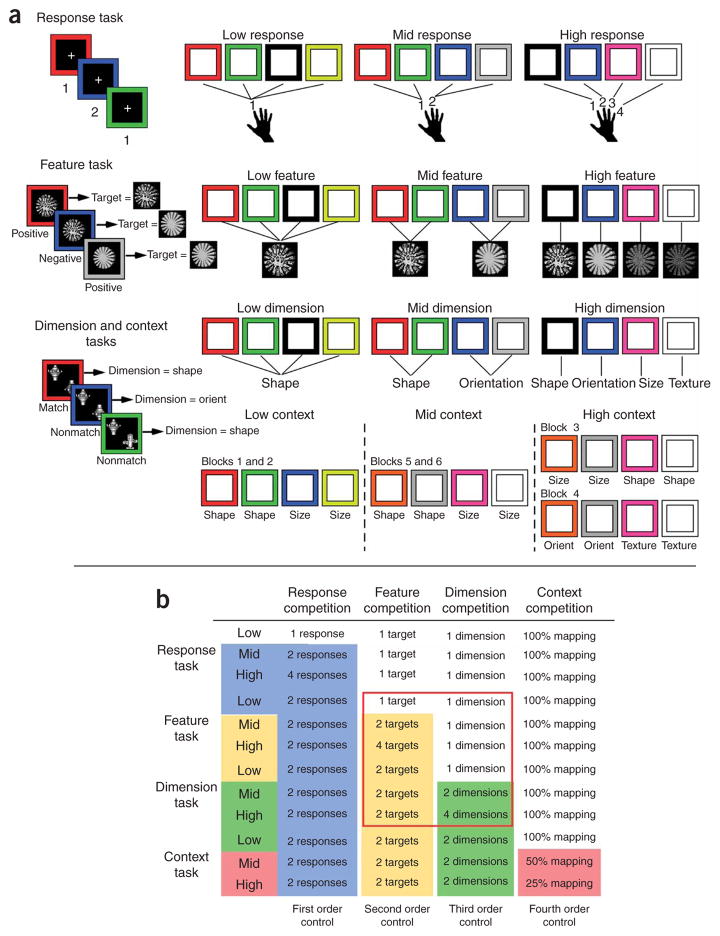
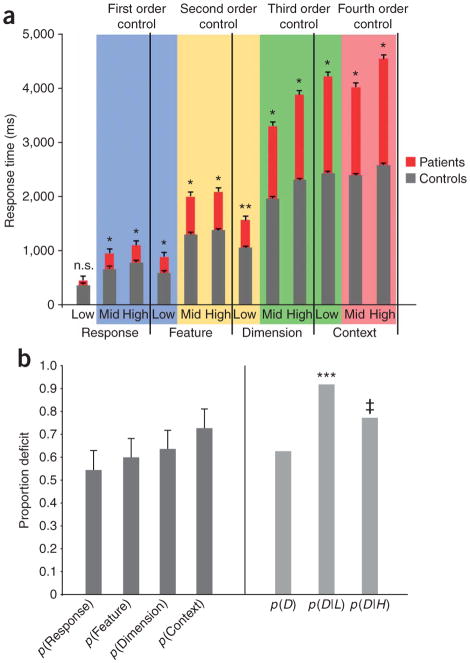
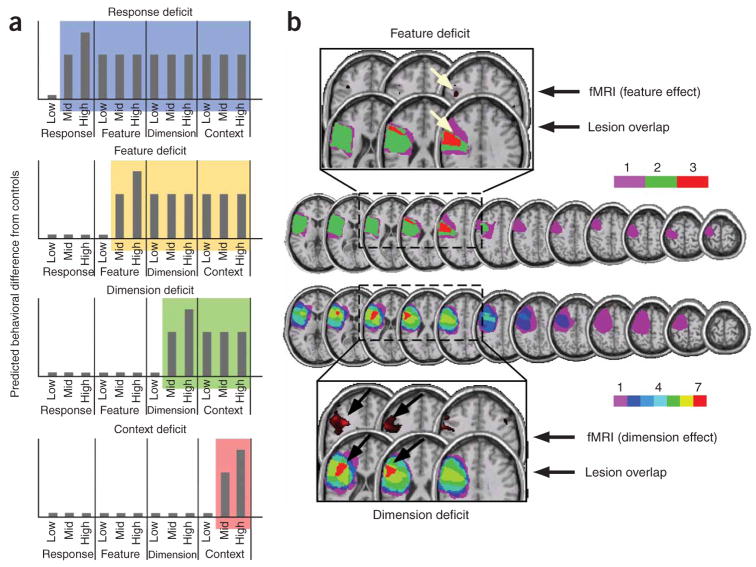
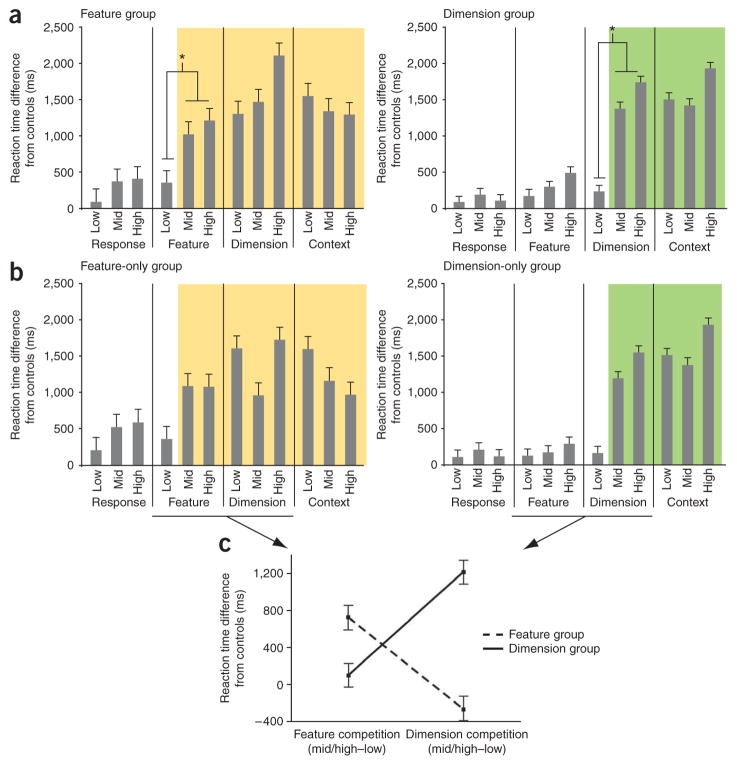
Cognitive control permits us to make decisions about abstract actions, such as whether to e-mail versus call a friend, and to select the concrete motor programs required to produce those actions, based on our goals and knowledge. The frontal lobes are necessary for cognitive control at all levels of abstraction. Recent neuroimaging data have motivated the hypothesis that the frontal lobes are organized hierarchically, such that control is supported in progressively caudal regions as decisions are made at more concrete levels of action. We found that frontal damage impaired action decisions at a level of abstraction that was dependent on lesion location (rostral lesions affected more abstract tasks, whereas caudal lesions affected more concrete tasks), in addition to impairing tasks requiring more, but not less, abstract action control. Moreover, two adjacent regions were distinguished on the basis of the level of control, consistent with previous functional magnetic resonance imaging results. These results provide direct evidence for a rostro-caudal hierarchical organization of the frontal lobes.


Figures

Figure 1
Figure 1
Trial events and task analysis of the four response-selection tasks. (a) On each trial of the response task, participants chose a response key on the basis of the color of a presented square. Competition conditions were low (one response), mid (two alternative responses) and high (four alternative responses). On each trial of the feature task, the participant looked for a particular target feature (for example, a mottled texture) based on the color of the square. They made a positive response if the target feature was presented and a negative response otherwise. Competition conditions included one target feature (low), two alternative target features (mid) or four alternative target features (high). Logically, this manipulation increases the number of sets of response mappings from one to four. Thus, the number of targets may be thought of as the number of response sets. On each trial of the dimension and context tasks, the participant decided whether two objects matched along a particular dimension (for example, shape) that was cued by the color of the square. Dimension competition conditions were one dimension (low), two alternative dimensions (mid) or four alternative dimensions (high). During the context experiment, there were always two alternative dimensions, but competition was introduced by decreasing the frequency with which a given color mapped to a given dimension (low, 100%; mid, 50%; high, 25% mapping frequency). Thus, by definition, from the first order through the fourth order of the hierarchy, competition was defined by the number of responses, targets, dimensions and mappings, respectively. (b) A task analysis depicts the nested hierarchical relationship in control demands (columns) among the four tasks (rows). Color-coding highlights conditions for which competition at the response (blue), feature (yellow), dimension (green) or context (red) levels was present. Thus, this table indicates how control demands at different levels accumulate as each level of contingency is added in each task. Also, note that the low-competition condition of each task is equivalent in control demands to the mid condition of the task one level subordinate. Finally, the red outline highlights the conditions permitting a crossover interaction.
Figure 2
Figure 2
Overall performance across the four tasks. (a) Reaction time for patients (red) and controls (gray) is plotted across the four tasks that increase, from left to right, in degree (low, mid and high) and order of competition (response, feature, dimension and context). Color-coding indicates conditions across tasks that include equivalent levels of conflict at the response (blue), feature (yellow), dimension (green) or context (red) levels but no higher-order competition. Notably, the difference between patients and controls grew as higher-order control was required (*P < 0.05, **P = 0.06, error bars represent s.e.m.). (b) The proportion of patients showing deficits in each task grew quantitatively, but not reliably, from response to context (left). Notably, however, the probability of a deficit at any level, p(D), was reliably greater when conditioned on a deficit at any lower level, p(D|L), relative to when it was conditioned on a deficit at any higher level, p(D|H). (***indicates Bayes factor of 6.7, ‡ indicates Bayes factor of 2, error bars represent s.e.m.)
Figure 3
Figure 3
Observer-independent overlap analysis. (a) Regressors were generated representing the pattern of data across tasks and conditions for an idealized deficit at each level of control on the basis of the asymmetrical hierarchical assumptions. Bars indicate difference from controls in arbitrary units. Color-coding highlights the conditions for which deficits should emerge for patients with impairments in response (blue), feature (yellow), dimension (green) and context (red) control. (b) Results from the lesions overlap analysis revealed a distinction in the peak of overlap (red) among dimension patients around the IFS/dorsolateral prefrontal cortex and the peak of overlap (red) among feature patients in anterior dorsal premotor cortex. Color bar indicates the number of patients contributing to each colored region. Insets show correspondence between sites of lesion overlap from this study and the activation associated with the parametric effect of dimension (top) and feature (bottom) conflict from ref. . Arrows on slices are in the same position for precise comparison.
Figure 4
Figure 4
Performance of dimension and feature patient groups. (a) The differences in reaction time between patients and controls in the feature (left) and dimension (right) groups are plotted across competition conditions and tasks. Colored shading highlights occurrences of a reliable stepwise increase in a feature (yellow) or dimension (green) control deficit (*P < 0.05). (b) The differences in reaction time between patients and controls in the feature (left) and dimension (right) groups, excluding the one patient that was categorized as having both feature and dimension deficits, are plotted across competition conditions and tasks. (c) The differences from controls in the reaction time change between conflict (mid/high) and nonconflict (low) conditions of the feature (left) and dimension (right) tasks are plotted for the feature-only (blue) and dimension-only (red) overlap groups. The crossover interaction supports a double dissociation between these groups. All error bars represent s.e.m.

References

    1. Badre D, Wagner AD. Selection, integration and conflict monitoring; assessing the nature and generality of prefrontal cognitive control mechanisms. Neuron. 2004;41:473–487. - PubMed
    1. D’Esposito M, et al. The neural basis of the central executive system of working memory. Nature. 1995;378:279–281. - PubMed
    1. D’Esposito M, Postle BR, Rypma B. Prefrontal cortical contributions to working memory: evidence from event-related fMRI studies. Exp Brain Res. 2000;133:3–11. - PubMed
    1. Duncan J. An adaptive coding model of neural function in prefrontal cortex. Nat Rev Neurosci. 2001;2:820–829. - PubMed
    1. Fuster JM. The Prefrontal Cortex: Anatomy, Physiology and Neuropsychology of the Frontal Lobe. Lippincott-Raven Publishers; Philadelphia, Pennsylvania: 1997.

Publication types

MeSH terms