. 2009 Mar 1;48(7):1328-36.
doi: 10.1364/ao.48.001328.

Quantitative fluorescence tomography with functional and structural a priori information

Affiliations

Quantitative fluorescence tomography with functional and structural a priori information

Yuting Lin et al. Appl Opt. .

Abstract

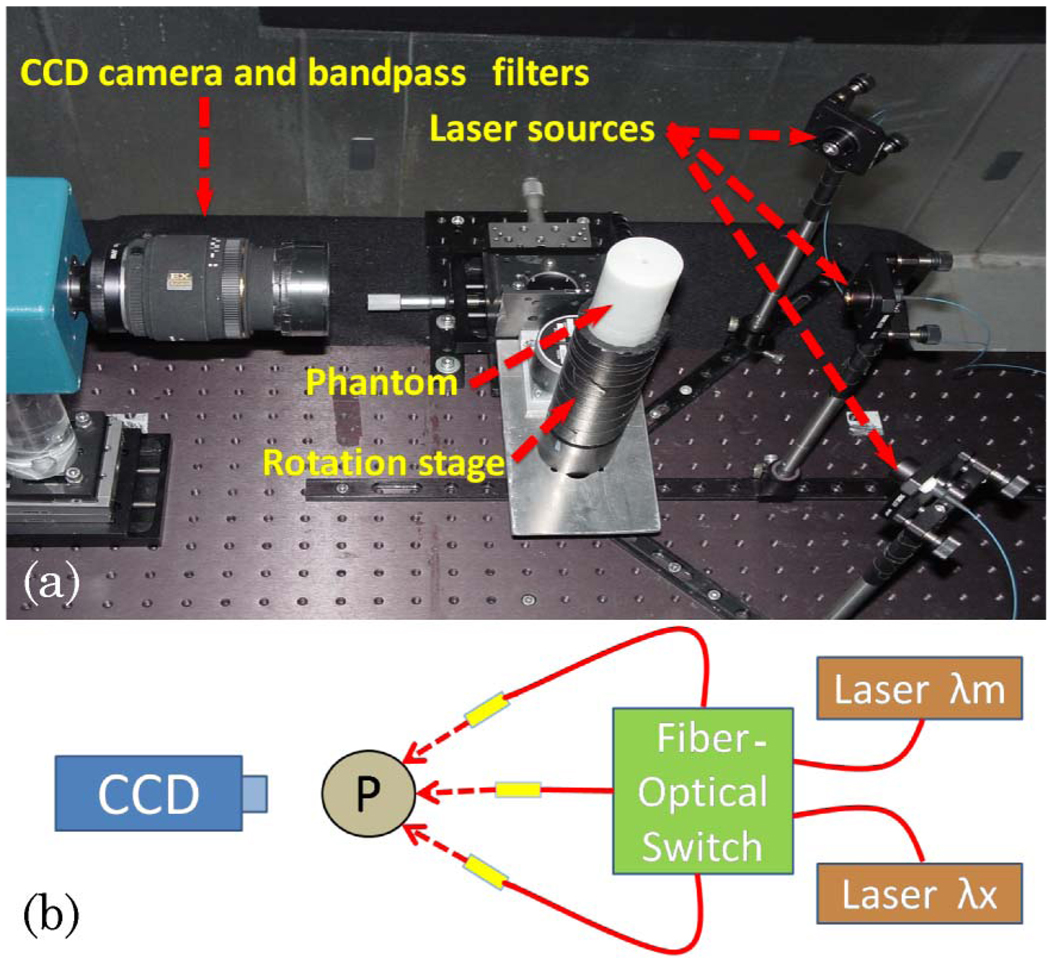
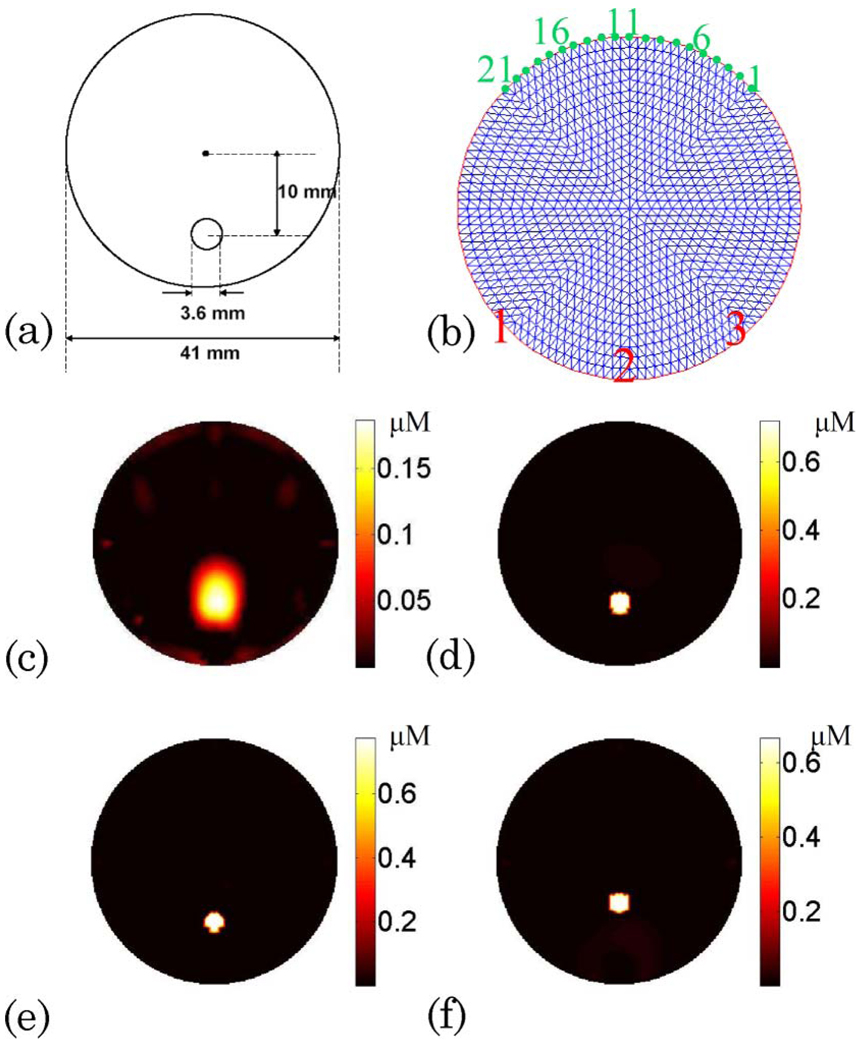
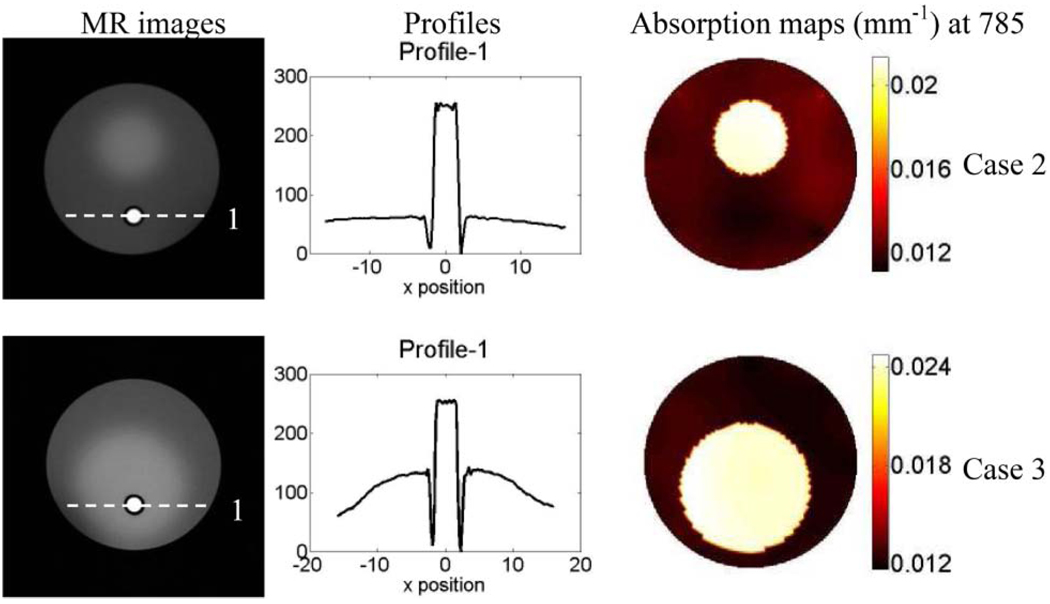
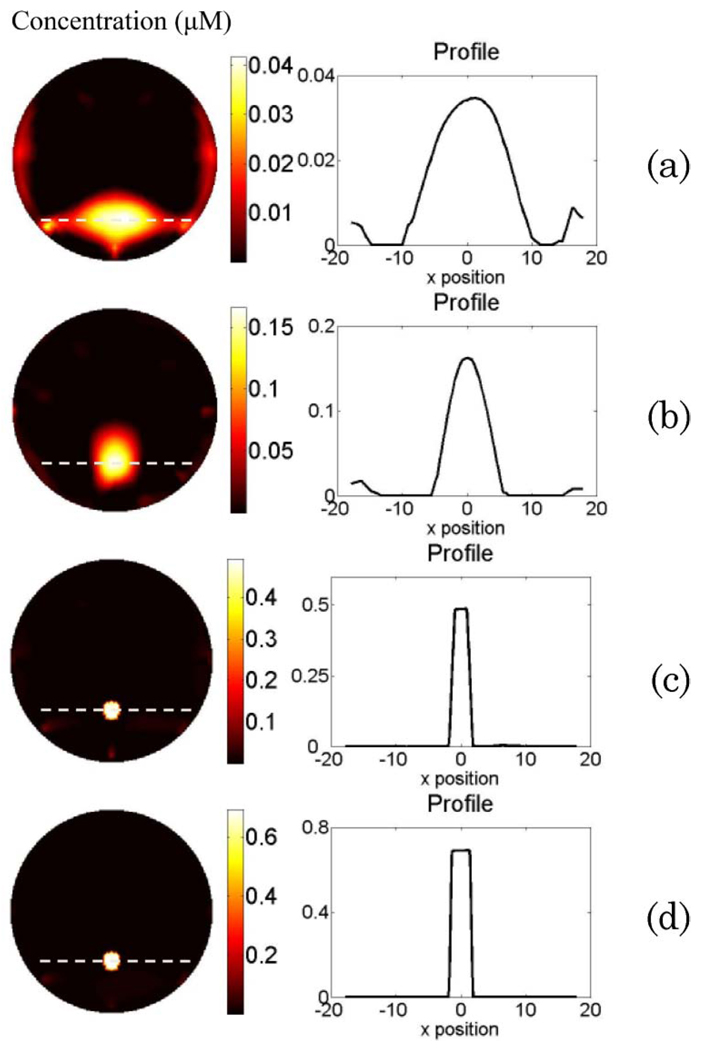
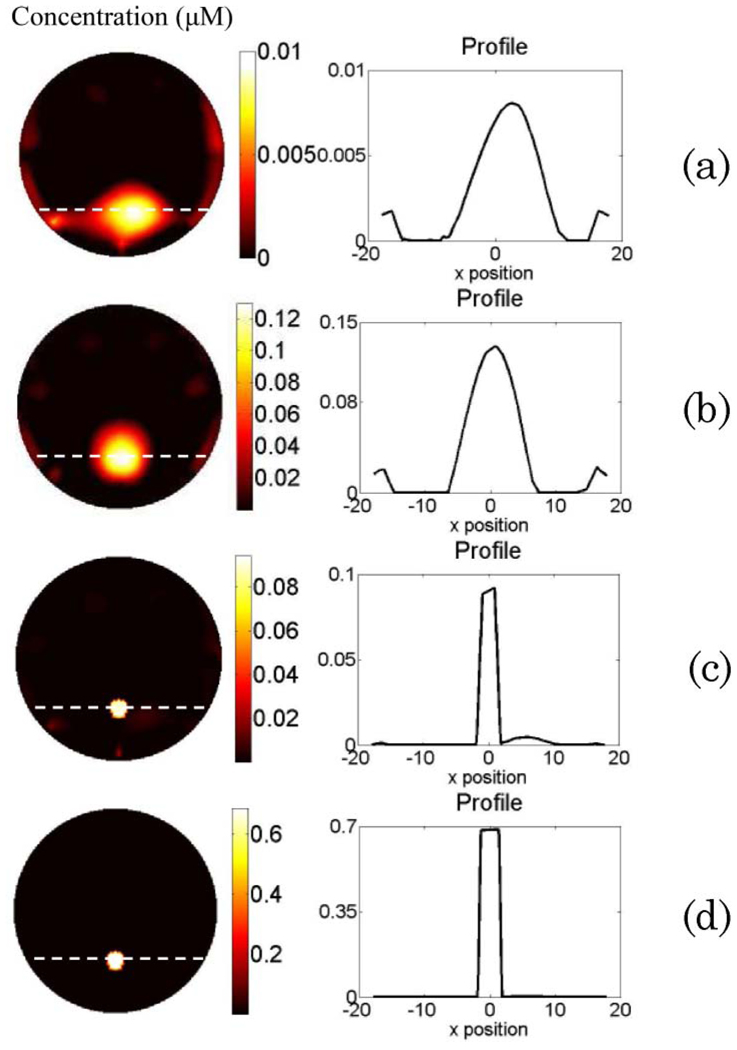
We demonstrate the necessity of functional and structural a priori information for quantitative fluorescence tomography (FT) with phantom studies. Here the functional a priori information is defined as the optical properties of the heterogeneous background that can be measured by a diffuse optical tomography (DOT) system. A CCD-based noncontact hybrid FT/DOT system that could take measurements at multiple views was built. Multimodality phantoms with multiple compartments were constructed and used in the experiments to mimic a heterogeneous optical background. A 3.6 mm diameter object deeply embedded in a heterogeneous optical background could be localized without any a priori information, but the recovered fluorophore concentration only reached one tenth of the true concentration. On the other hand, the true fluorophore concentration could be recovered when both functional and structural a priori information is utilized to guide and constrain the FT reconstruction algorithm.


Figures

Fig. 1
Fig. 1
(Color online) (a) Photograph of the setup (top view). The CCD camera is on the left-hand side, the cylindrical phantom is placed on a rotation stage, and the phantom is illuminated from one of the three source positions, indicated by arrows. (b) Schematic showing the fiber-optic switch used to illuminate the object (P) from any one of three different positions (L1, L2, and L3). It also allows the selection of either the emission (λm) or the excitation (λx) wavelength.
Fig. 2
Fig. 2
(Color online) (a) Schematic showing the 3:6 mm diameter object located 10 mm away from the center of the medium. (b) Schematic showing the three source positions 45° apart from each other (indicated in red numbers). The 21 detectors are equally distributed at the boundaries (indicated in green numbers). (c) Reconstructed fluorophore concentration map for Case 1 without the guidance of structural a priori information. Please note that the absorption coefficient of the homogeneous background is found from the DOT measurements and is used as the functional a priori information. (d) Reconstructed fluorophore concentration map for Case 1 when the structural a priori information is utilized. (e), (f) Reconstructed fluorophore concentration map when the object size is underestimated by 10% and the object location is estimated 3 mm off from the structural images, respectively.
Fig. 3
Fig. 3
(Color online) First column is the T1 weighted MR images of the phantoms for phantom study Cases 2 and 3. The fluorophore is held by a transparent tube with 0:5 mm wall thickness (dark circle shown in MR image). The middle column is the plot of the profile along the x axis across the fluorescence object (as indicated by the dashed line in the MR images). The absorption maps at 785 nm are displayed in the third column.
Fig. 4
Fig. 4
(Color online) Phantom study results for Case 2. The reconstructed fluorophore concentration maps are shown in the left column when (a) using erroneous absorption coefficient and disregarding the background heterogeneity; (b) using reconstructed absorption map from DOT measurement as the functional a priori information in the FT reconstruction; (c) using erroneous absorption coefficient, disregarding the background heterogeneity, and using only the structural a priori information for FT reconstruction; and (d) using reconstructed absorption map as the functional a priori information and applying the structural a priori information during the FT reconstruction. The right column is the plot of the profile along the x axis across the fluorescence object (as indicated by the dashed line in the reconstructed map).
Fig. 5
Fig. 5
(Color online) Phantom study results for Case 3. The reconstructed fluorophore concentration maps are shown in the left column when (a) using erroneous absorption coefficient and disregarding the background heterogeneity; (b) using reconstructed absorption map from DOT measurement as the functional a priori information in the FT reconstruction; (c) using erroneous absorption coefficient, disregarding the background heterogeneity, and using only the structural a priori information for FT reconstruction; (d) using reconstructed absorption map as the functional a priori information and applying the structural a priori information during the FT reconstruction. The right column is the plot of the profile along the x axis across the fluorescence object (as indicated by the dashed line in the reconstructed map).

Similar articles

Cited by

References

    1. Ntziachristos V, Ripoll J, Wang LV, Weissleder R. Looking and listening to light: the evolution of whole-body photonic imaging. Nat. Biotechnol. 2005;23:313–320. - PubMed
    1. Bremer C, Ntziachristos V, Weitkamp B, Theilmeier G, Heindel W, Weissleder R. Optical imaging of spontaneous breast tumors using protease sensing ‘smart’ optical probes. Invest. Radiol. 2005;40:321–327. - PubMed
    1. Becker A, Hessenius C, Licha K, Ebert B, Sukowski U, Semmler W, Wiedenmann B, Grotzinger C. Receptortargeted optical imaging of tumors with near-infrared fluorescent ligands. Nat. Biotechnol. 2001;19:327–331. - PubMed
    1. Pu Y, Wang WB, Tang GC, Zeng F, Achilefu S, Vitenson JH, Sawczuk I, Peters S, Lombardo JM, Alfano RR. Spectral polarization imaging of human prostate cancer tissue using a near-infrared receptor-targeted contrast agent. Technol. Cancer. Res. Treat. 2005;4:429–436. - PubMed
    1. Ntziachristos V. Fluorescence molecular imaging. Annu. Rev. Biomed. Eng. 2006;8:1–33. - PubMed

Publication types