. 2009:525:337-52, xiv.
doi: 10.1007/978-1-59745-554-1_18.

Mammalian cell display for antibody engineering

Affiliations

Mammalian cell display for antibody engineering

Mitchell Ho et al. Methods Mol Biol. 2009.

Abstract

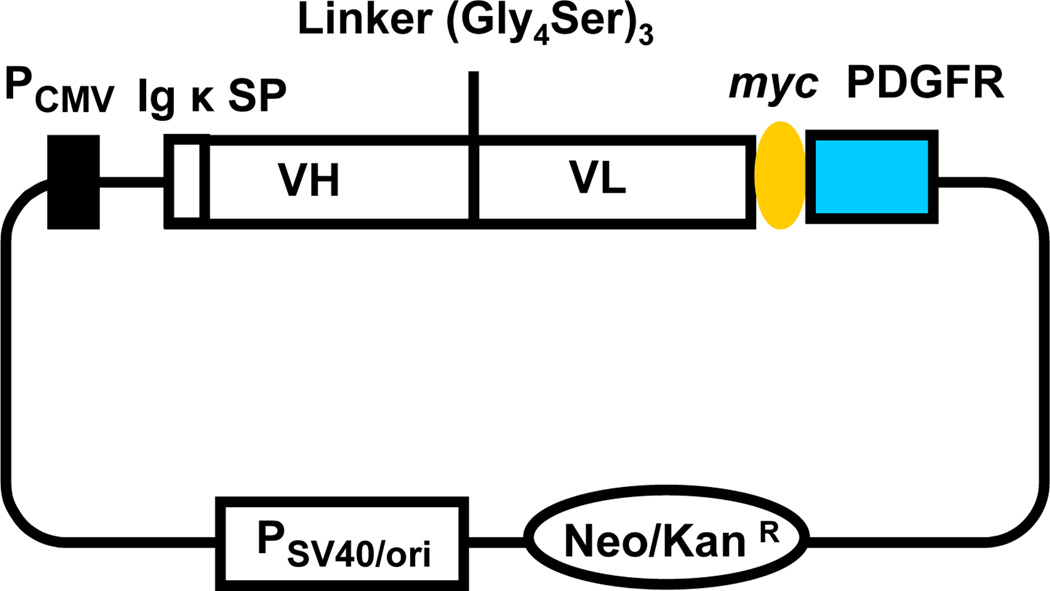
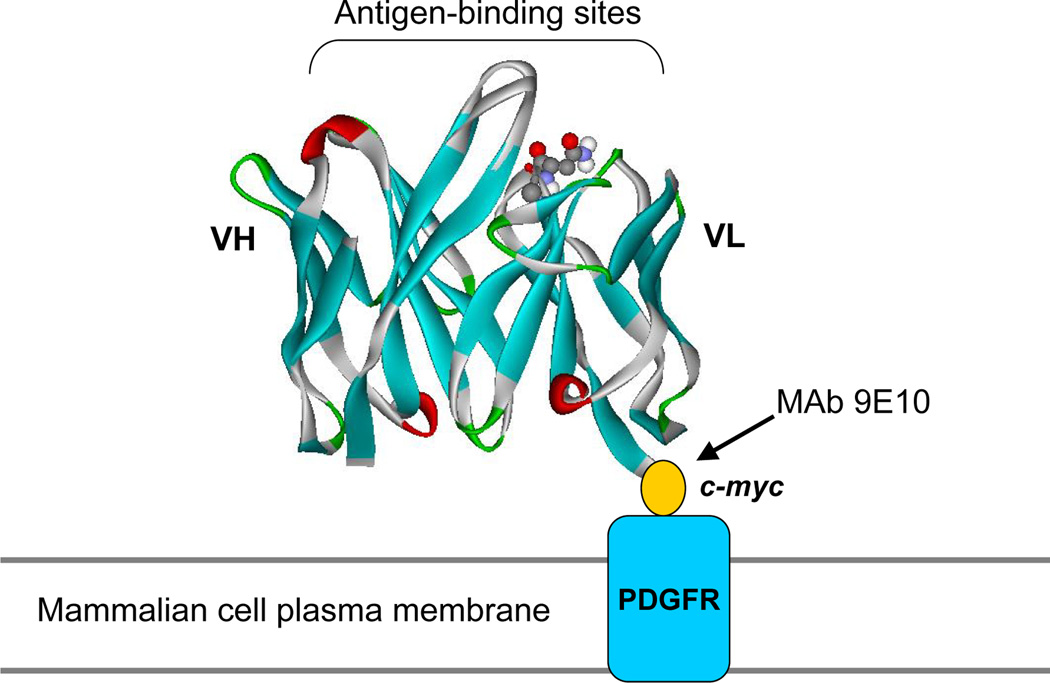
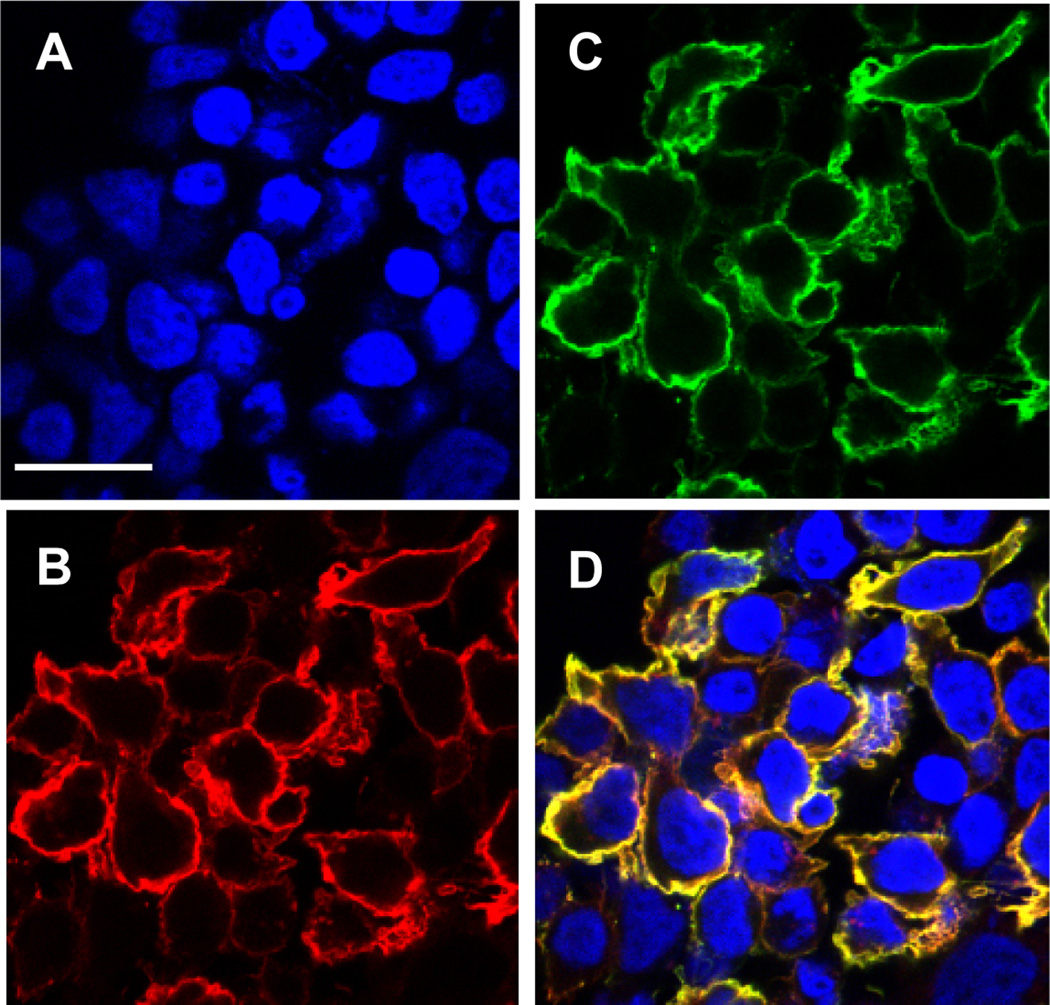
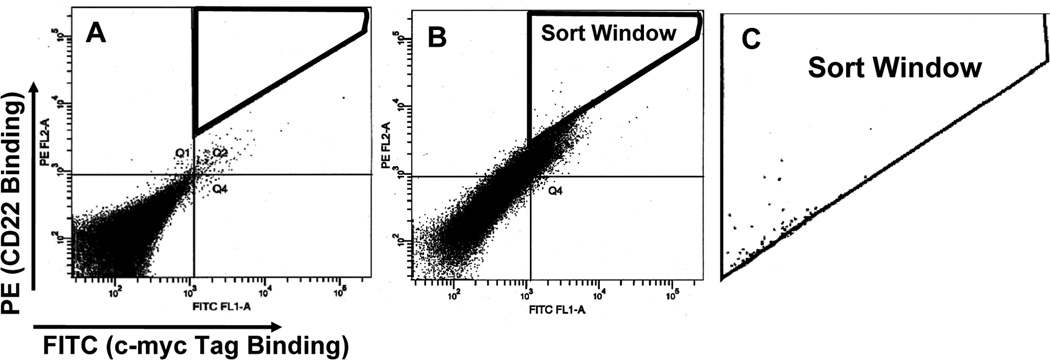
Antibody engineering has generally been carried out by displaying mouse or human antibodies or antibody fragments on the surface of microorganisms (phage, bacteria, and yeast). We have shown that mammalian cells can be used to display single-chain antibody fragments (scFvs) for affinity maturation. Using mammalian cell display one can isolate and engineer scFvs, Fabs, or whole IgGs for increased affinity and other specific biological functions. Here, we describe a mammalian cell display strategy to isolate high-affinity scFvs specific for CD22. Our strategy uses flow cytometry and human embryonic kidney 293T (HEK-293T) cells that are widely used for transient protein expression. Flow cytometry enhances the screen's sensitivity thereby allowing us to isolate high-affinity antibodies.


Figures

Fig. 1
Fig. 1
Diagram of expression plasmid for display of scFv on mammalian cells. PCMVcytomegalovirus promoter; Igκ SP, murine Igκ chain signal peptide; VH, heavy chain variable region; VL, light chain variable region; Linker, a flexible synthetic linker between VH and VL; myc, an epitope tag to measure the scFv expression level; PDGFR, the transmembrane domain of human platelet-derived growth factor receptor; PSV40/oriSV40 promoter and origin facilitating episomal replication in mammalian cells expressing SV40 large T antigen; Neo/KanRneomycin- and kanamycin-resistance gene.
Fig. 2
Fig. 2
Schematic illustration of surface display on mammalian cells. An additional 10-amino acid epitope tag (c-myc) was fused to the C-terminus of the scFv (based on the anti-CD22 RFB4 Fv structural model) (13), allowing quantitation of fusion display with mAb 9E10 independent of antigen (CD22) binding. Fusion to the N-terminal portion of the PDGFR transmembrane domain was used to anchor scFv on the mammalian (HEK-293T) cell surface. (Originally published in Proceedings of the National Academy of Sciences 103(25):9637–9642, June 20, 2006); copyright 2006 National Academy of Sciences, U.S.A.
Fig. 3
Fig. 3
Confocal microscopic images of HEK-293T cells displaying scFv. HEK-293T cells transfected with a plasmid directing surface expression of anti-CD22 scFv were grown on cover slips. Transfected cells were fixed with 4,6-diamidino-2-phenylindole nuclear staining (A) followed by detection with biotinylated CD22-Fc (B), and anti-c-myc antibody (C) followed by Steptavidin-Alexa Fluor 594 and anti-mouse IgG-Alexa Fluor 488. (D) shows merged staining patterns. Scale bar = 25 µm. (Originally published in Proceedings of the National Academy of Sciences 103(25):9637–9642, June 20, 2006); copyright 2006 National Academy of Sciences, U.S.A.
Fig. 4
Fig. 4
Enrichment of mammalian cells displaying an improved scFv variant by kinetic selection and flow cytometric sorting. The dot plot shows only 50,000 cells of the total cell population (107). Each dot represents an individual observed cell. This is the 1:400 mixture of HA22:BL22-displaying cells, labeled with no antigen (A) or 1nM antigen (CD22-Fc) (B) concentration for separation. FITC fluorescence (binding to the c-myc tag) represents the number of surface expressions on an individual cell. The PE fluorescence represents binding to the antigen (CD22). A sort window (C) was drawn to include the top 0.1% of total cells in terms of ratio of PE:FITC fluorescence. Cells that fell within the window were collected. (Originally published in Proceedings of the National Academy of Sciences 103(25):9637–9642, June 20, 2006); copyright 2006 National Academy of Sciences, U.S.A.
Fig. 5
Fig. 5
Equilibrium binding titration curves to determine dissociation constants, KD. MFI (%) of PE is plotted versus the various concentrations of biotinylated CD22-Fc used to label surface-displayed BL22 (wild-type, KD = 5.8nM, Bmax = 453), HA22 (KD = 2.5nM, Bmax = 293) or mutant PT (KD = 1.2nM, Bmax = 275) antibody. Data are fit with a nonlinear least-squares regression. (Originally published in Proceedings of the National Academy of Sciences 103(25):9637–9642, June 20, 2006); copyright 2006 National Academy of Sciences, U.S.A.

Similar articles

Cited by

References

    1. Adams GP, Weiner LM. Monoclonal antibody therapy of cancer. Nat. Biotechnol. 2005;23:1147–1157. - PubMed
    1. Foote J, Eisen HN. Kinetic and affinity limits on antibodies produced during immune responses. Proc. Natl. Acad. Sci. USA. 1995;92:1254–1256. - PMC - PubMed
    1. Smith GP. Filamentous fusion phage: novel expression vectors that display cloned antigens on the virion surface. Science. 1985;228:1315–1317. - PubMed
    1. Winter G, Griffiths AD, Hawkins RE, Hoogenboom HR. Making antibodies by phage display technology. Annu. Rev. Immunol. 1994;12:433–455. - PubMed
    1. Boder ET, Wittrup KD. Yeast surface display for screening combinatorial polypeptide libraries. Nat. Biotechnol. 1997;15:553–557. - PubMed

Publication types

LinkOut - more resources