

Functional involvement of protein kinase C-betaII and its substrate, myristoylated alanine-rich C-kinase substrate (MARCKS), in insulin-stimulated glucose transport in L6 rat skeletal muscle cells
- PMID: 19252893
- PMCID: PMC2677811
- DOI: 10.1007/s00125-009-1298-7
Functional involvement of protein kinase C-betaII and its substrate, myristoylated alanine-rich C-kinase substrate (MARCKS), in insulin-stimulated glucose transport in L6 rat skeletal muscle cells
Abstract
Aims/hypothesis: Insulin stimulates phosphorylation cascades, including phosphatidylinositol-3-kinase (PI3K), phosphatidylinositol-dependent kinase (PDK1), Akt, and protein kinase C (PKC). Myristoylated alanine-rich C-kinase substrate (MARCKS), a PKCbetaII substrate, could link the effects of insulin to insulin-stimulated glucose transport (ISGT) via phosphorylation of its effector domain since MARCKS has a role in cytoskeletal rearrangements.
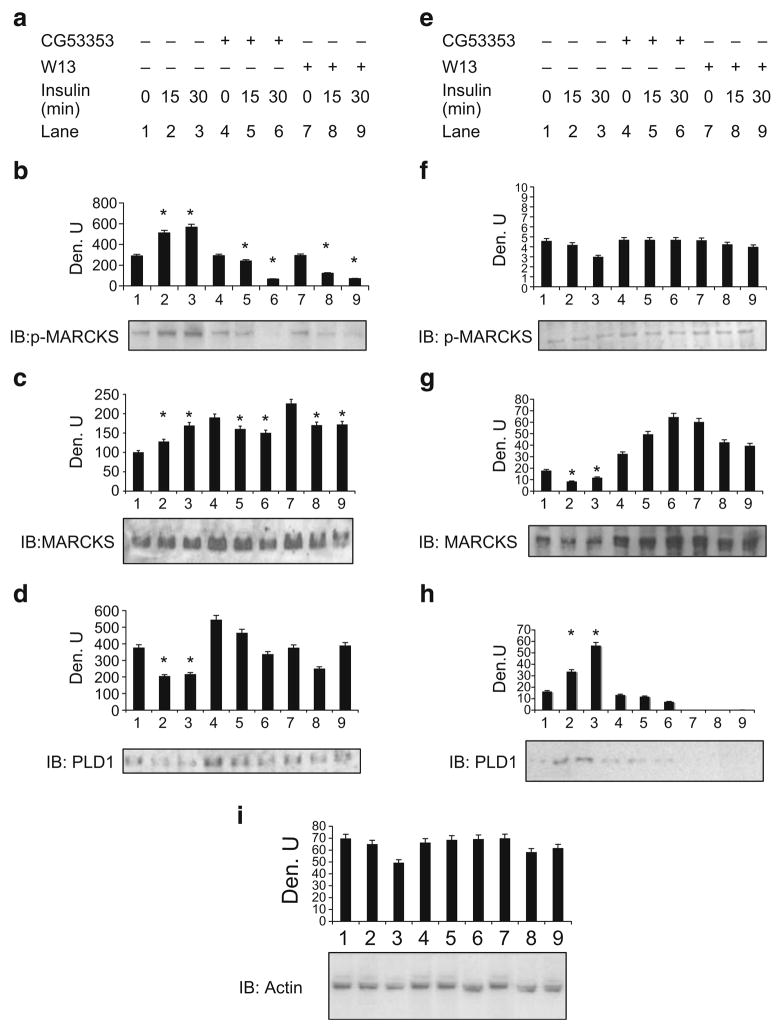
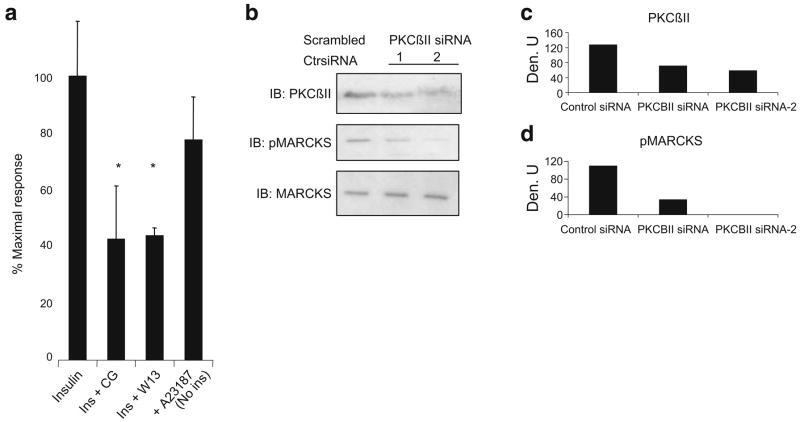
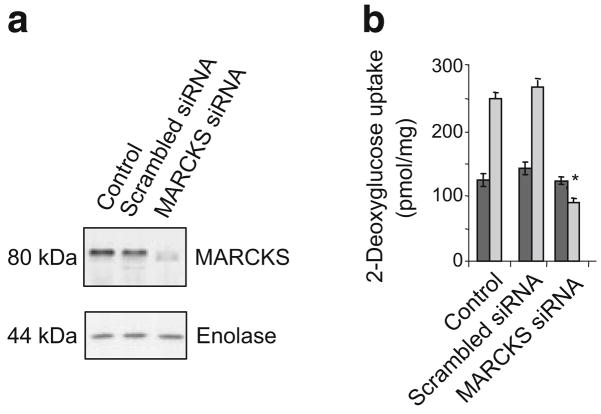
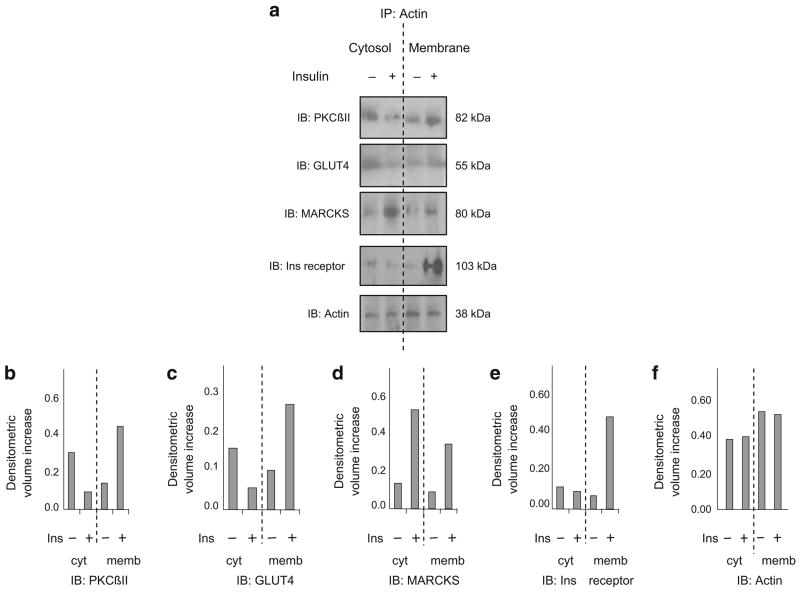
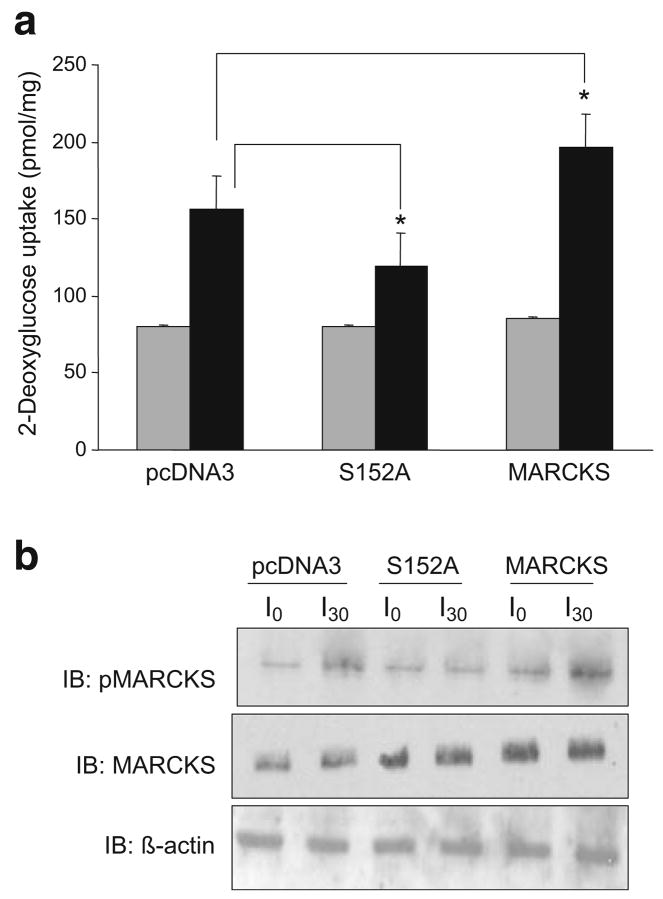
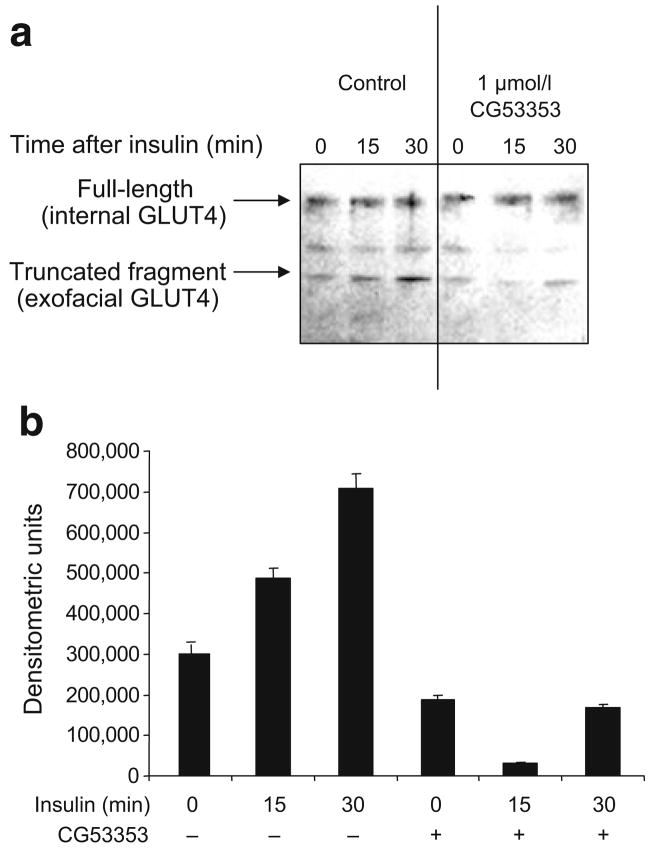
Methods: We examined phosphoPKCbetaII after insulin treatment of L6 myocytes, and cytosolic and membrane phosphoMARCKS, MARCKS and phospholipase D1 in cells pretreated with LY294002 (PI3K inhibitor), CG53353 (PKCbetaII inhibitor) or W13 (calmodulin inhibitor), PI3K, PKCbetaII and calmodulin inhibitors, respectively, before insulin treatment, using western blots. ISGT was examined after cells had been treated with inhibitors, small inhibitory RNA (siRNA) for MARCKS, or transfection with MARCKS mutated at a PKC site. MARCKS, PKCbetaII, GLUT4 and insulin receptor were immunoblotted in subcellular fractions with F-actin antibody immunoprecipitates to demonstrate changes following insulin treatment. GLUT4 membrane insertion was followed after insulin with or without CG53353.
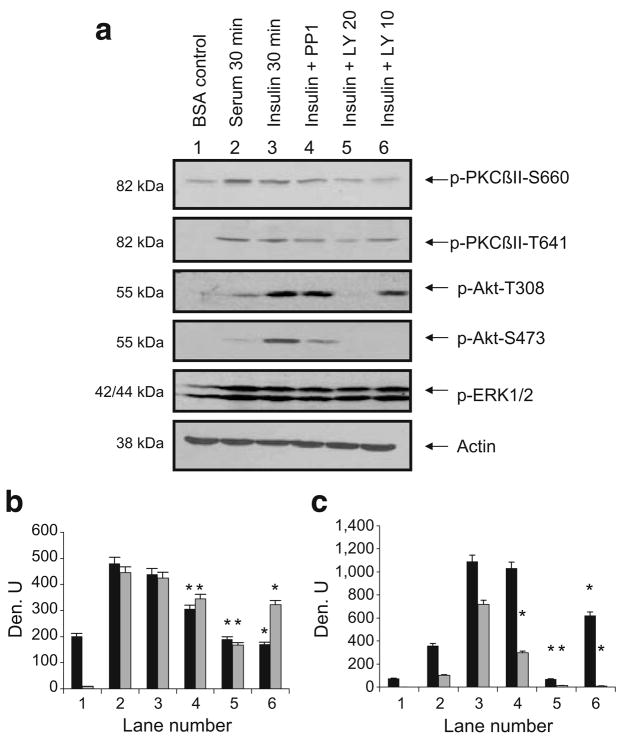
Results: Insulin increased phosphoPKCbetaII(Ser660 and Thr641); LY294002 blocked this, indicating its activation by PI3K. Insulin treatment increased cytosolic phosphoMARCKS, decreased membrane MARCKS and increased membrane phospholipase D1 (PLD1), a protein regulating glucose transporter vesicle fusion resulted. PhosphoMARCKS was attenuated by CG53353 or MARCKS siRNA. MARCKS siRNA blocked ISGT. Association of PKCbetaII and GLUT4 with membrane F-actin was enhanced by insulin, as was that of cytosolic and membrane MARCKS. ISGT was attenuated in myocytes transfected with mutated MARCKS (Ser152Ala), whereas overproduction of wild-type MARCKS enhanced ISGT. CG53353 blocked insertion of GLUT4 into membranes of insulin treated cells.
Conclusions/interpretation: The results suggest that PKCbetaII is involved in mediating downstream steps of ISGT through MARCKS phosphorylation and cytoskeletal remodelling.
Figures
Similar articles
-
Myristoylated alanine-rich C kinase substrate-mediated neurotensin release via protein kinase C-delta downstream of the Rho/ROK pathway.J Biol Chem. 2005 Mar 4;280(9):8351-7. doi: 10.1074/jbc.M409431200. Epub 2004 Dec 28. J Biol Chem. 2005. PMID: 15623535
-
Developmentally spliced PKCbetaII provides a possible link between mTORC2 and Akt kinase to regulate 3T3-L1 adipocyte insulin-stimulated glucose transport.Biochem Biophys Res Commun. 2009 Oct 23;388(3):554-9. doi: 10.1016/j.bbrc.2009.08.063. Epub 2009 Aug 15. Biochem Biophys Res Commun. 2009. PMID: 19686698 Free PMC article.
-
Effects of insulin and phorbol esters on MARCKS (myristoylated alanine-rich C-kinase substrate) phosphorylation (and other parameters of protein kinase C activation) in rat adipocytes, rat soleus muscle and BC3H-1 myocytes.Biochem J. 1993 Oct 1;295 ( Pt 1)(Pt 1):155-64. doi: 10.1042/bj2950155. Biochem J. 1993. PMID: 8216211 Free PMC article.
-
Calmodulin and protein kinase C cross-talk: the MARCKS protein is an actin filament and plasma membrane cross-linking protein regulated by protein kinase C phosphorylation and by calmodulin.Ciba Found Symp. 1992;164:145-54; discussion 154-61. doi: 10.1002/9780470514207.ch10. Ciba Found Symp. 1992. PMID: 1395931 Review.
-
Thrombin-induced phosphorylation of MARCKS does not alter its interactions with calmodulin or actin.Cell Signal. 2000 Feb;12(2):71-9. doi: 10.1016/s0898-6568(99)00065-0. Cell Signal. 2000. PMID: 10679575 Review.
Cited by
-
Possible Role of Phosphatidylglycerol-Activated Protein Kinase C-βII in Keratinocyte Differentiation.Open Dermatol J. 2017;11:59-71. doi: 10.2174/1874372201711010059. Epub 2017 Oct 24. Open Dermatol J. 2017. PMID: 32528559 Free PMC article.
-
SOD1 overexpression in vivo blocks hyperglycemia-induced specific PKC isoforms: substrate activation and consequent lipid peroxidation in diabetic embryopathy.Am J Obstet Gynecol. 2011 Jul;205(1):84.e1-6. doi: 10.1016/j.ajog.2011.02.071. Epub 2011 Mar 5. Am J Obstet Gynecol. 2011. PMID: 21529760 Free PMC article.
-
Augmentation of Cathepsin Isoforms in Diabetic db/db Mouse Kidneys Is Associated with an Increase in Renal MARCKS Expression and Proteolysis.Int J Mol Sci. 2023 Aug 5;24(15):12484. doi: 10.3390/ijms241512484. Int J Mol Sci. 2023. PMID: 37569859 Free PMC article.
-
Taurolithocholate-induced MRP2 retrieval involves MARCKS phosphorylation by protein kinase Cϵ in HUH-NTCP Cells.Hepatology. 2013 Jul;58(1):284-92. doi: 10.1002/hep.26333. Epub 2013 May 14. Hepatology. 2013. PMID: 23424156 Free PMC article.
-
Fibroblast Migration Is Regulated by Myristoylated Alanine-Rich C-Kinase Substrate (MARCKS) Protein.PLoS One. 2013 Jun 19;8(6):e66512. doi: 10.1371/journal.pone.0066512. Print 2013. PLoS One. 2013. PMID: 23840497 Free PMC article.
References
-
- Osterhoff MA, Heuer S, Pfeiffer M, et al. Identification of a functional protein kinase C beta promoter polymorphism in humans related to insulin-resistance. Mol Genet Metab. 2008;93:210–215. - PubMed
-
- Ikeda Y, Suehiro T, Osaki F, Tsuzura S, Kumon Y, Hashimoto K. Polymorphisms in the 5′-upstream region of the PKCbeta gene in Japanese patients with Type 2 diabetes. Diabet Med. 2004;21:1113–1120. - PubMed
-
- Araki S, Ng DP, Krolewski B, et al. Identification of a common risk haplotype for diabetic nephropathy at the protein kinase C-beta1 (PRKCB1) gene locus. J Am Soc Nephrol. 2003;14:2015–2024. - PubMed
-
- Cortright RN, Azevedo JL, Jr, Zhou Q, et al. Protein kinase C modulates insulin action in human skeletal muscle. Am J Physiol Endocrinol Metab. 2000;278:E553–562. - PubMed
Publication types
MeSH terms
Substances
Grants and funding
LinkOut - more resources
Full Text Sources
Medical
Molecular Biology Databases
Miscellaneous
