. 2009 Apr;9(7):1744-53.
doi: 10.1002/pmic.200800425.

Energetic determinants of protein binding specificity: insights into protein interaction networks

Affiliations

Energetic determinants of protein binding specificity: insights into protein interaction networks

Pablo Carbonell et al. Proteomics. 2009 Apr.

Abstract

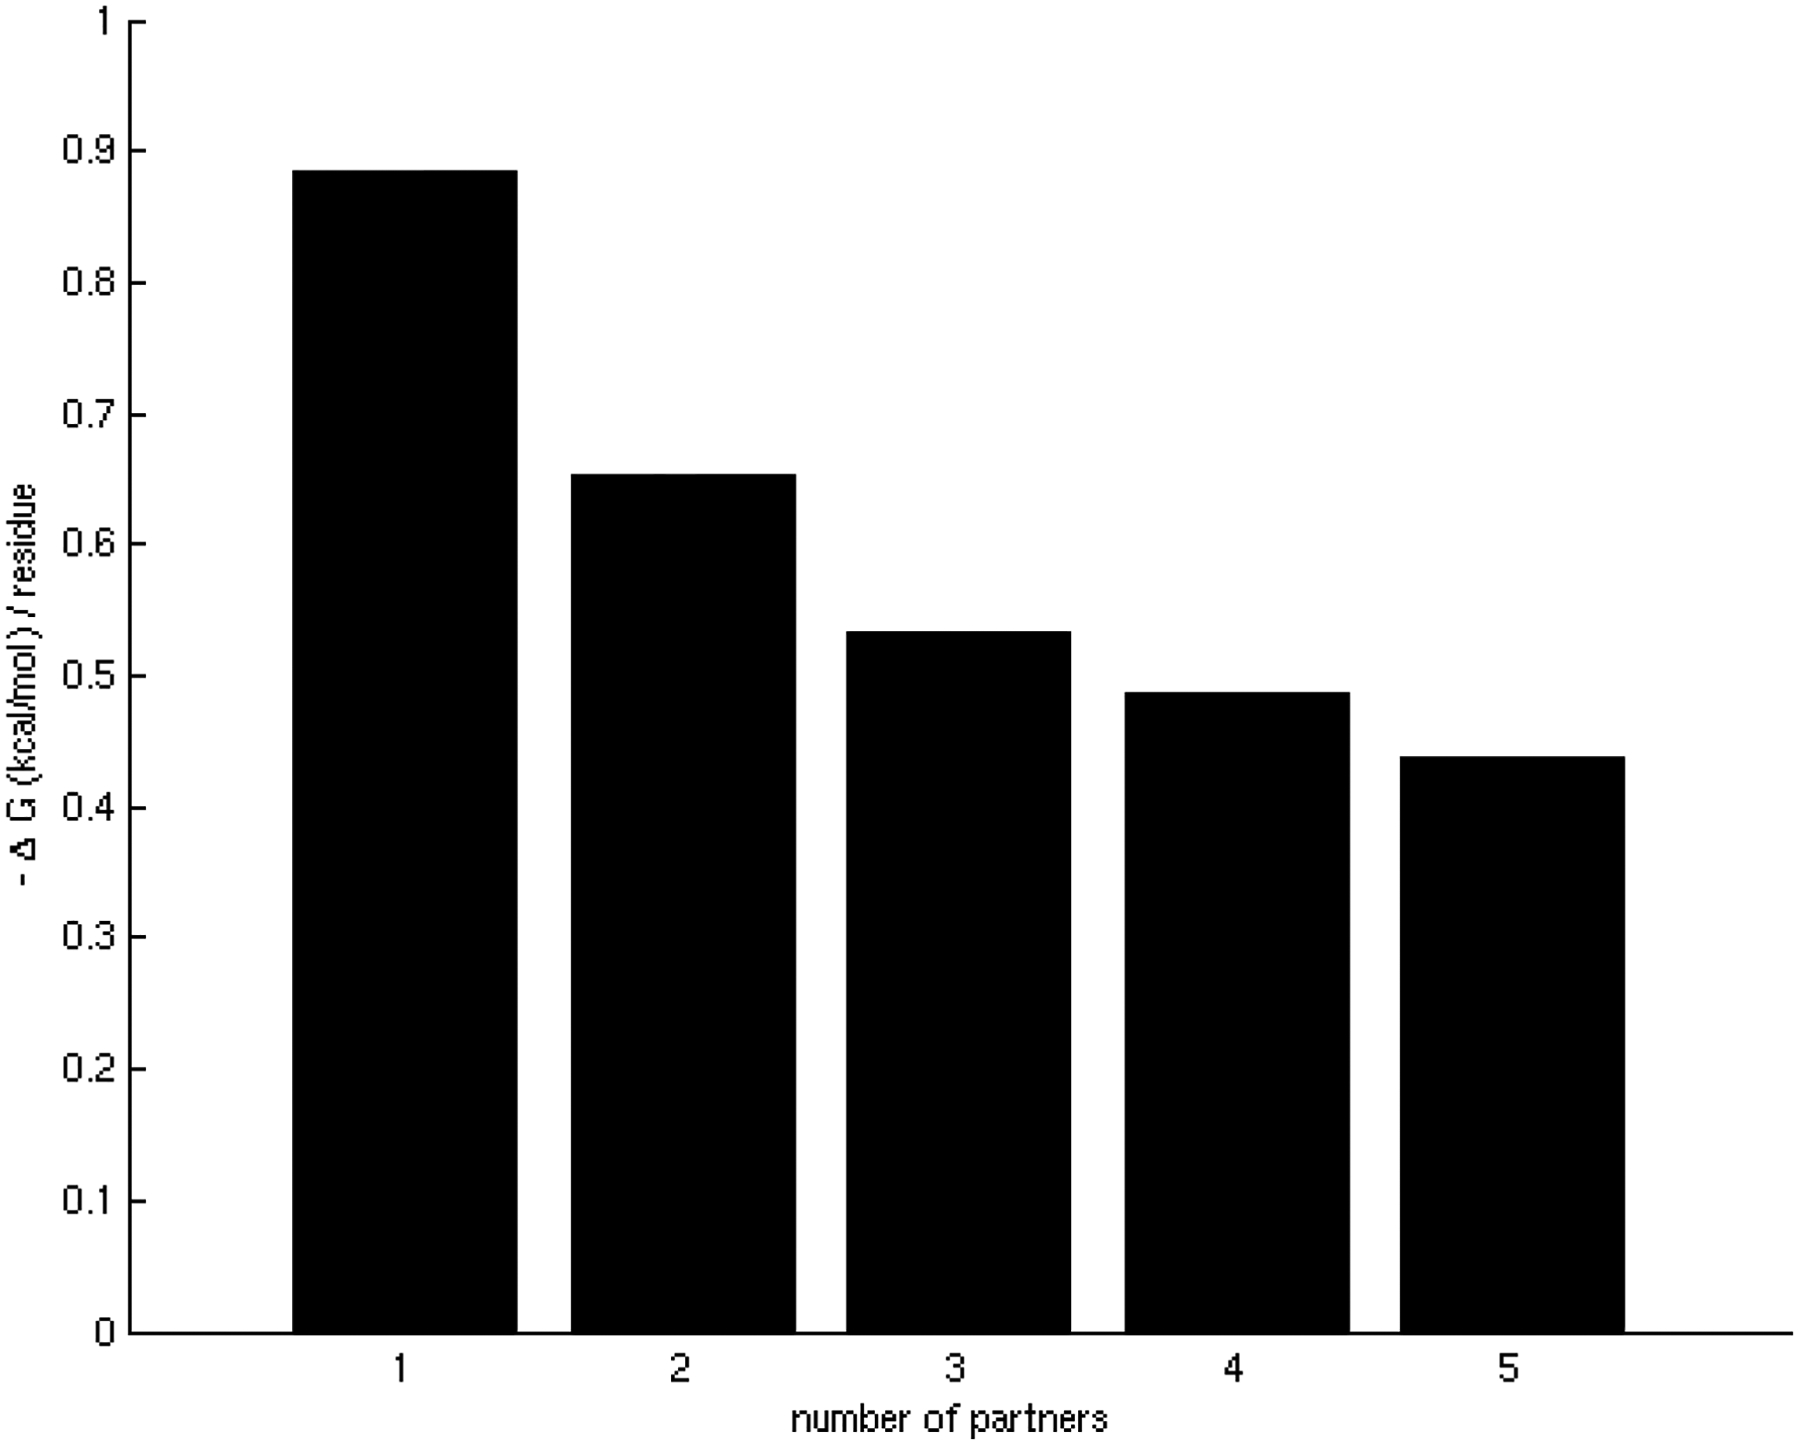
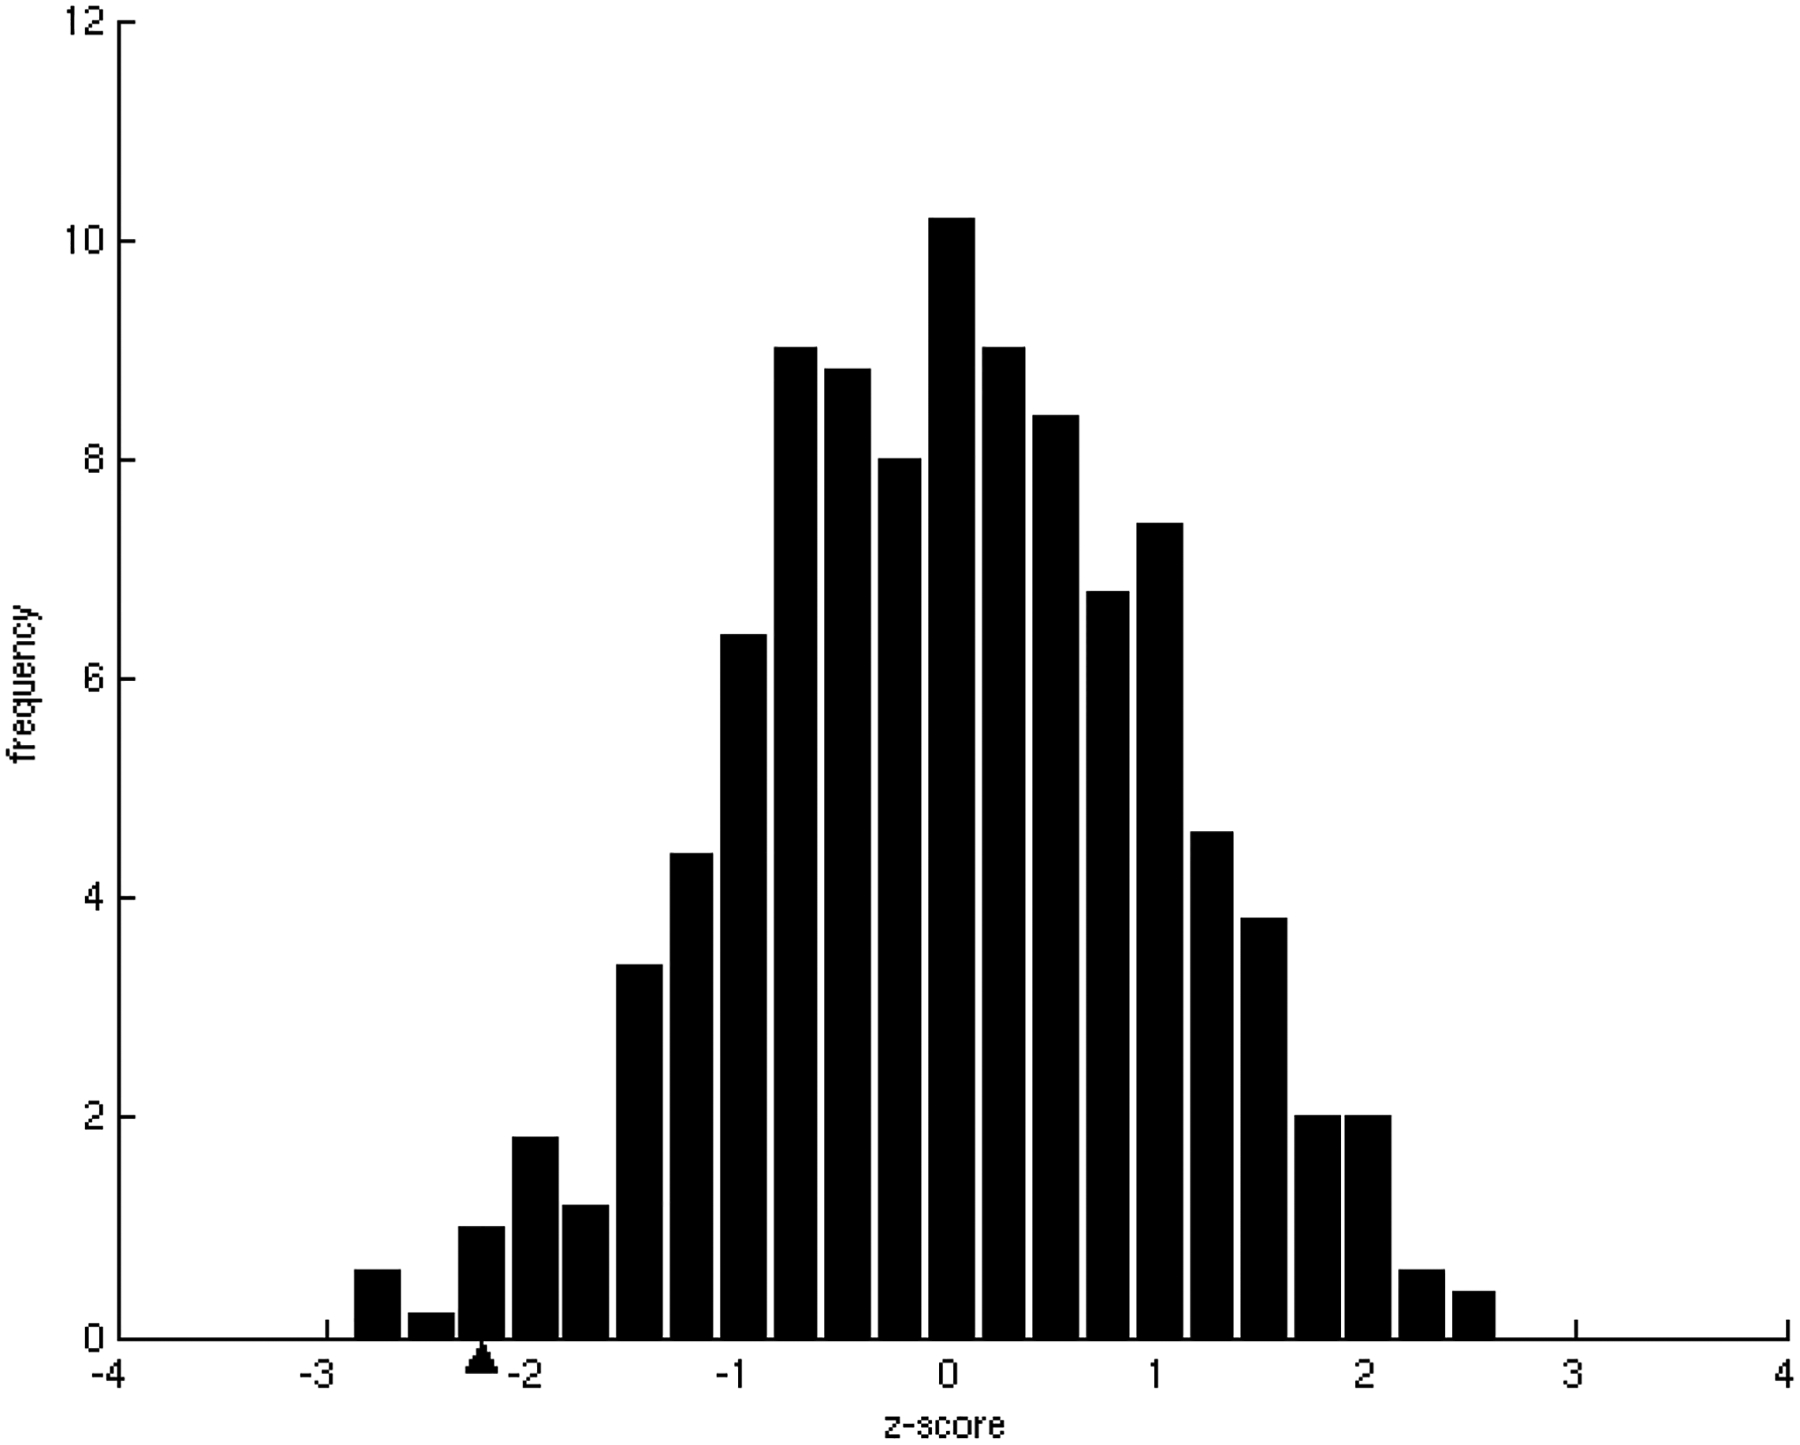
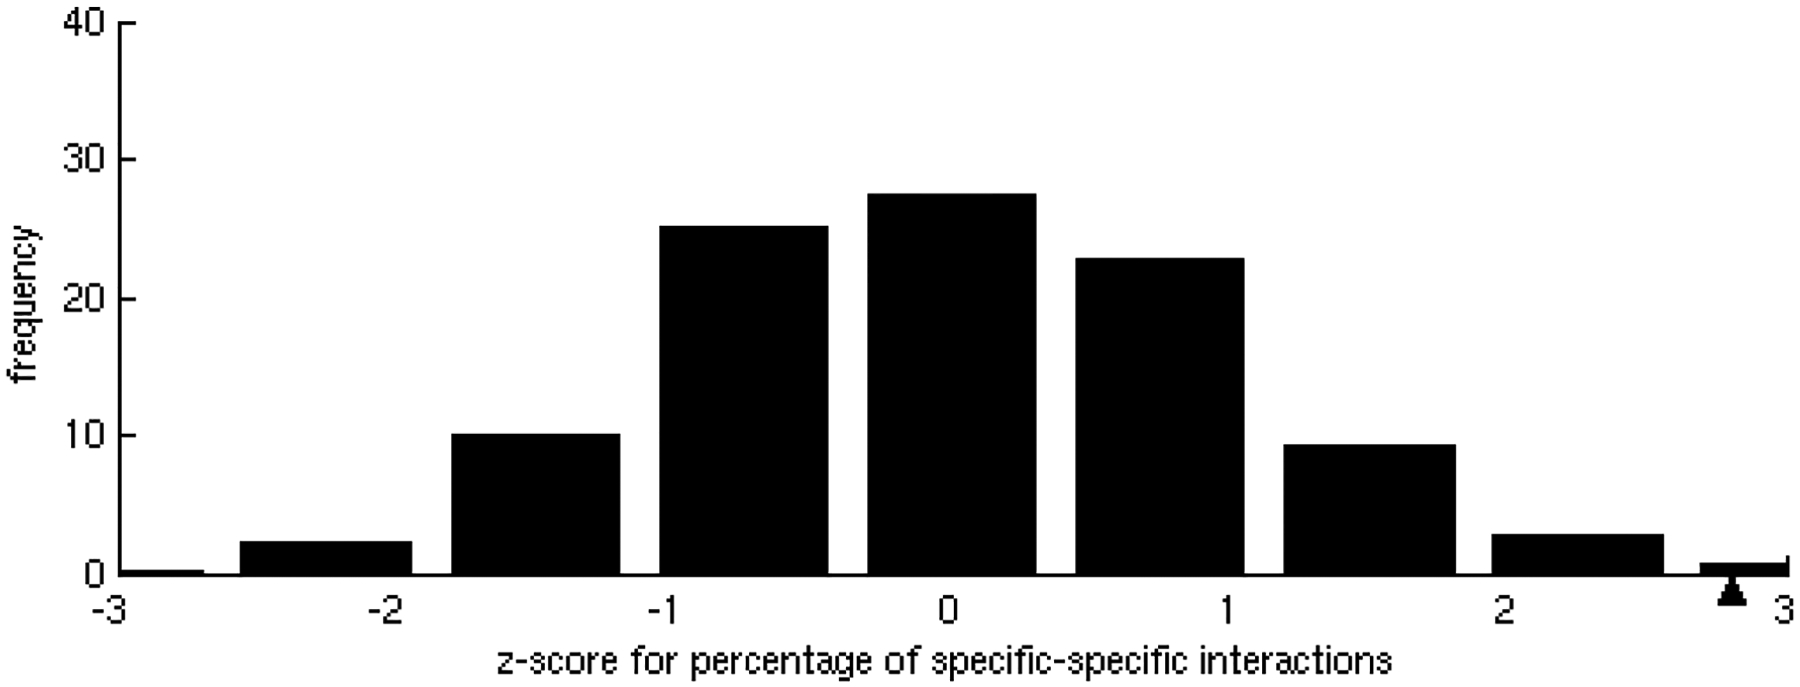
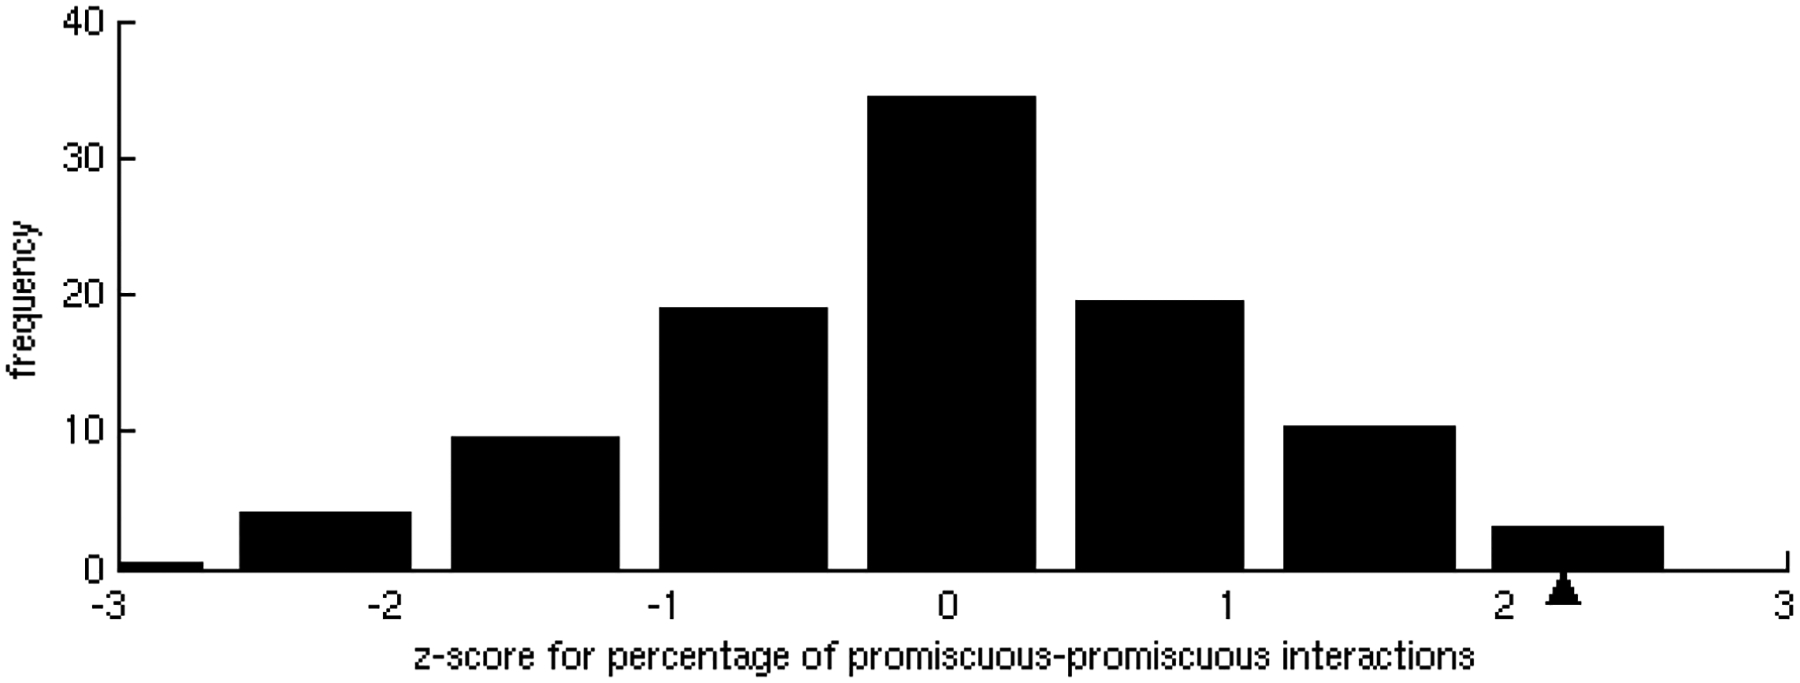
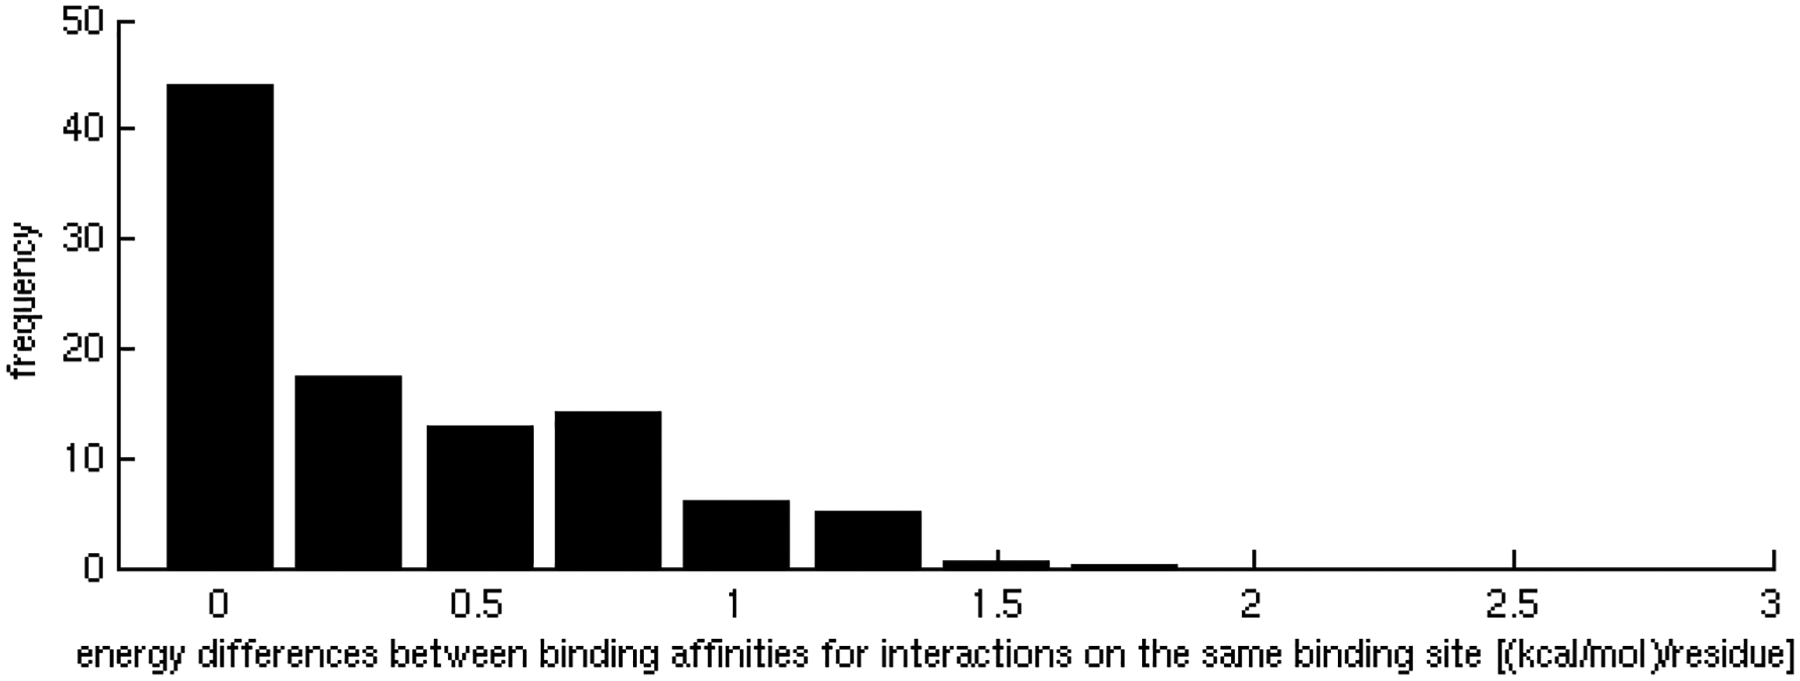
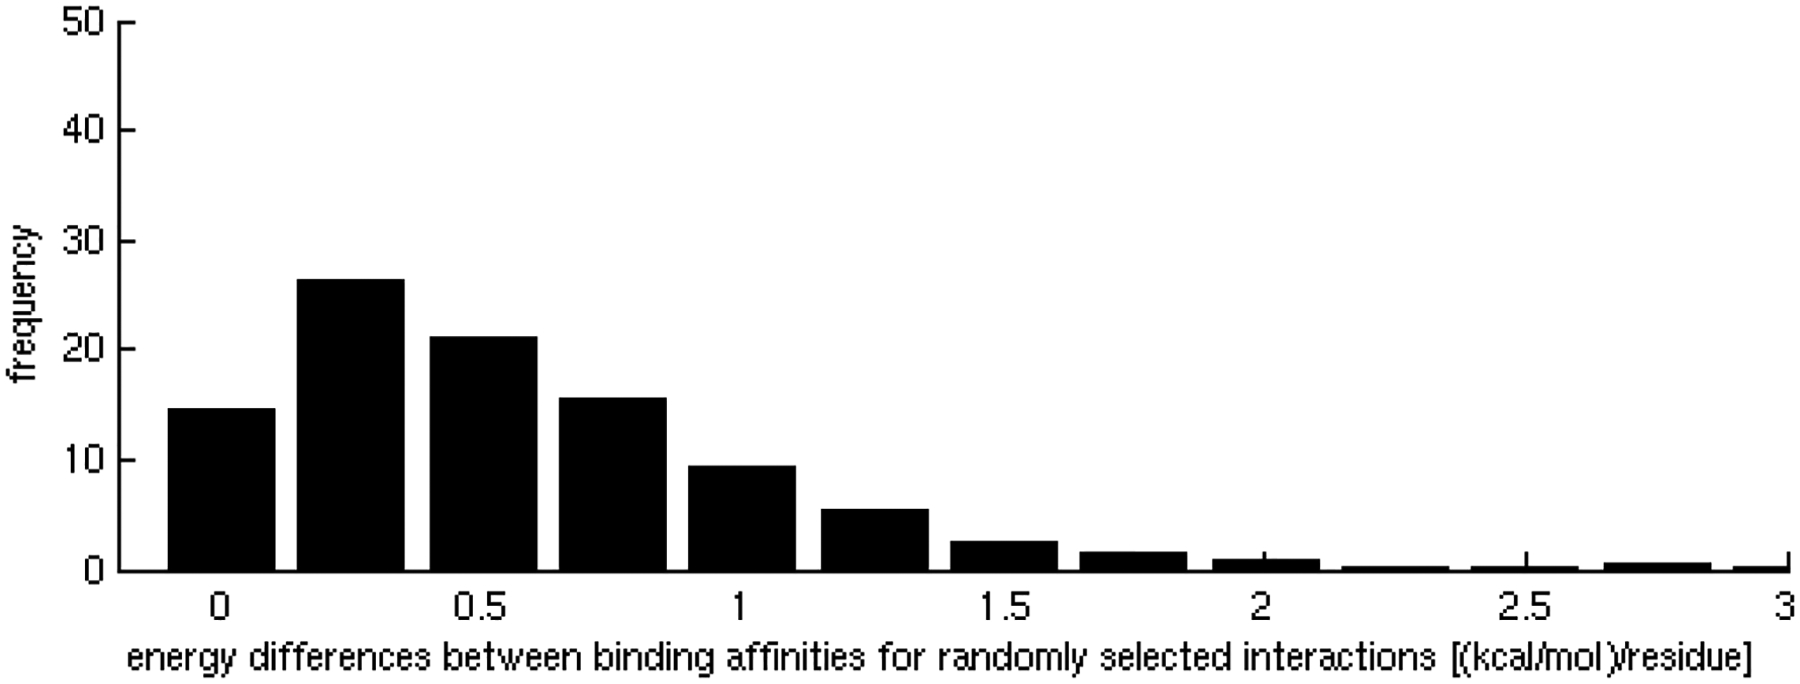
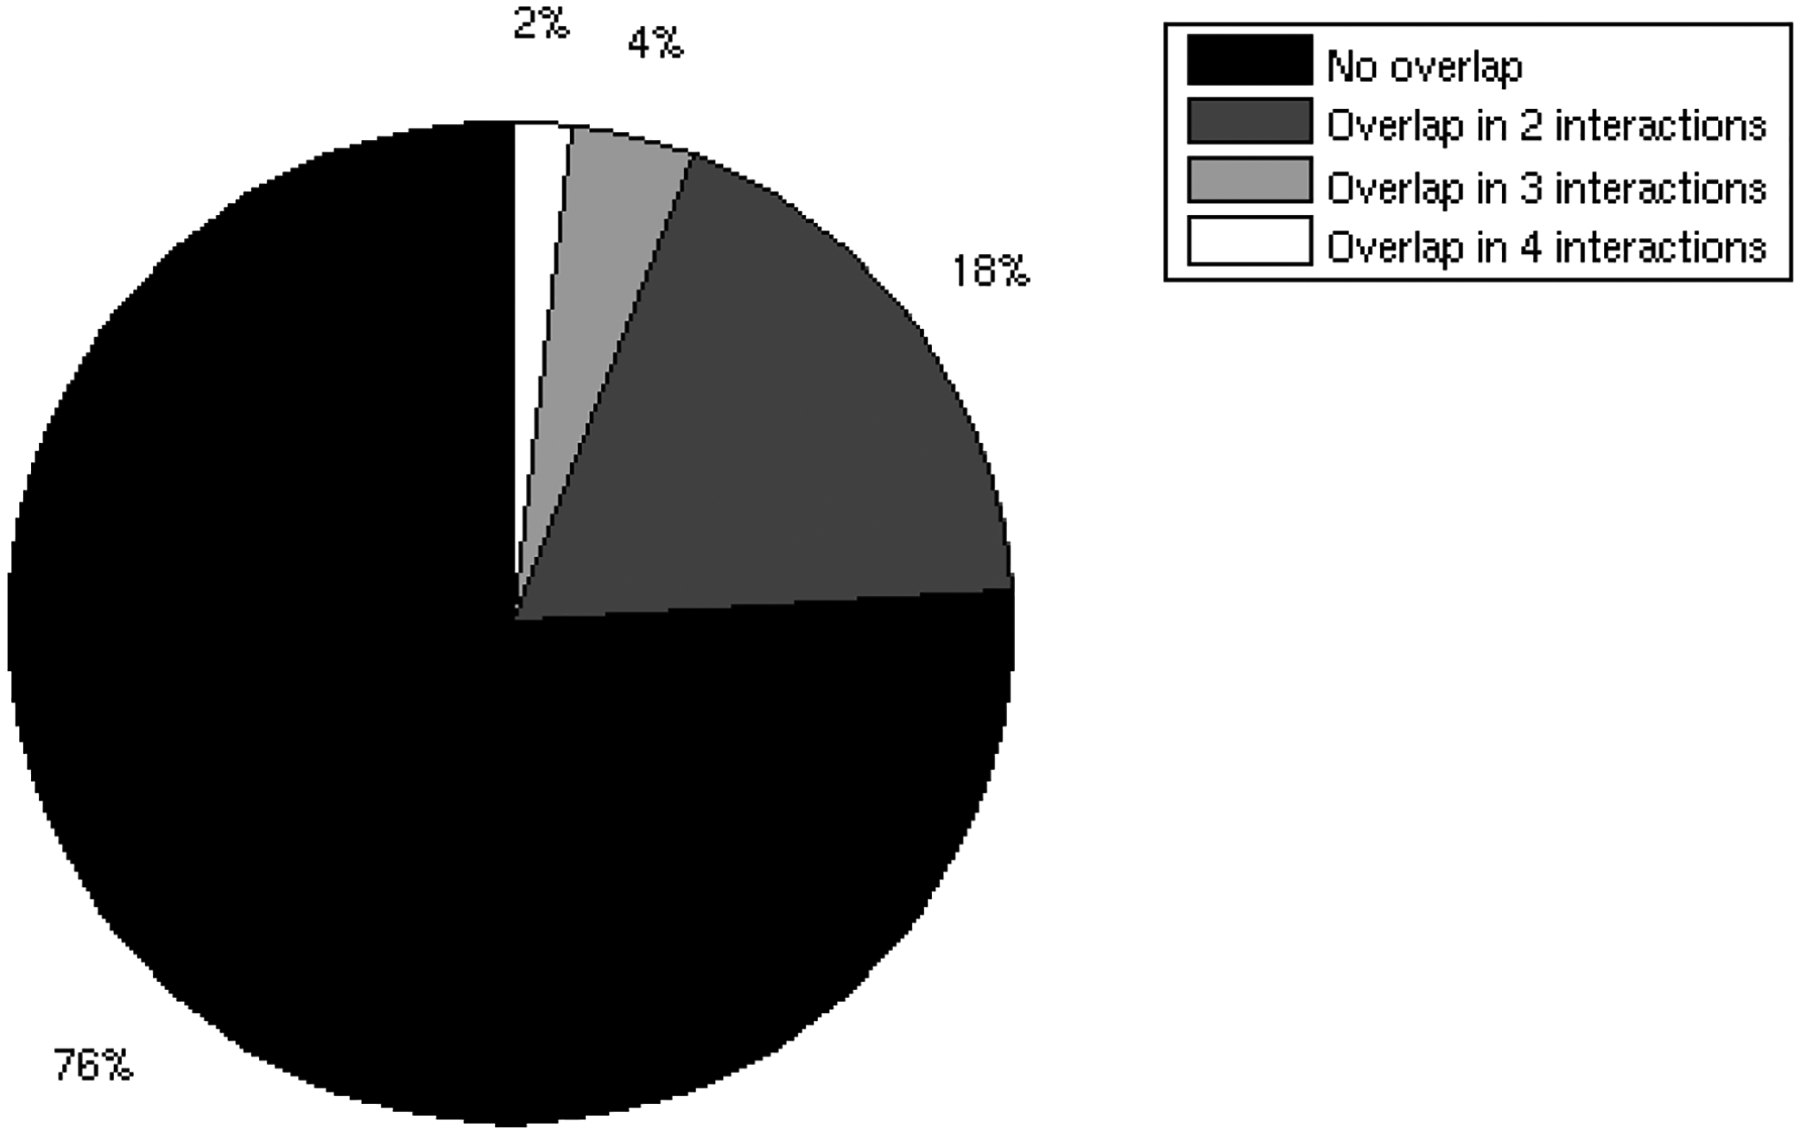
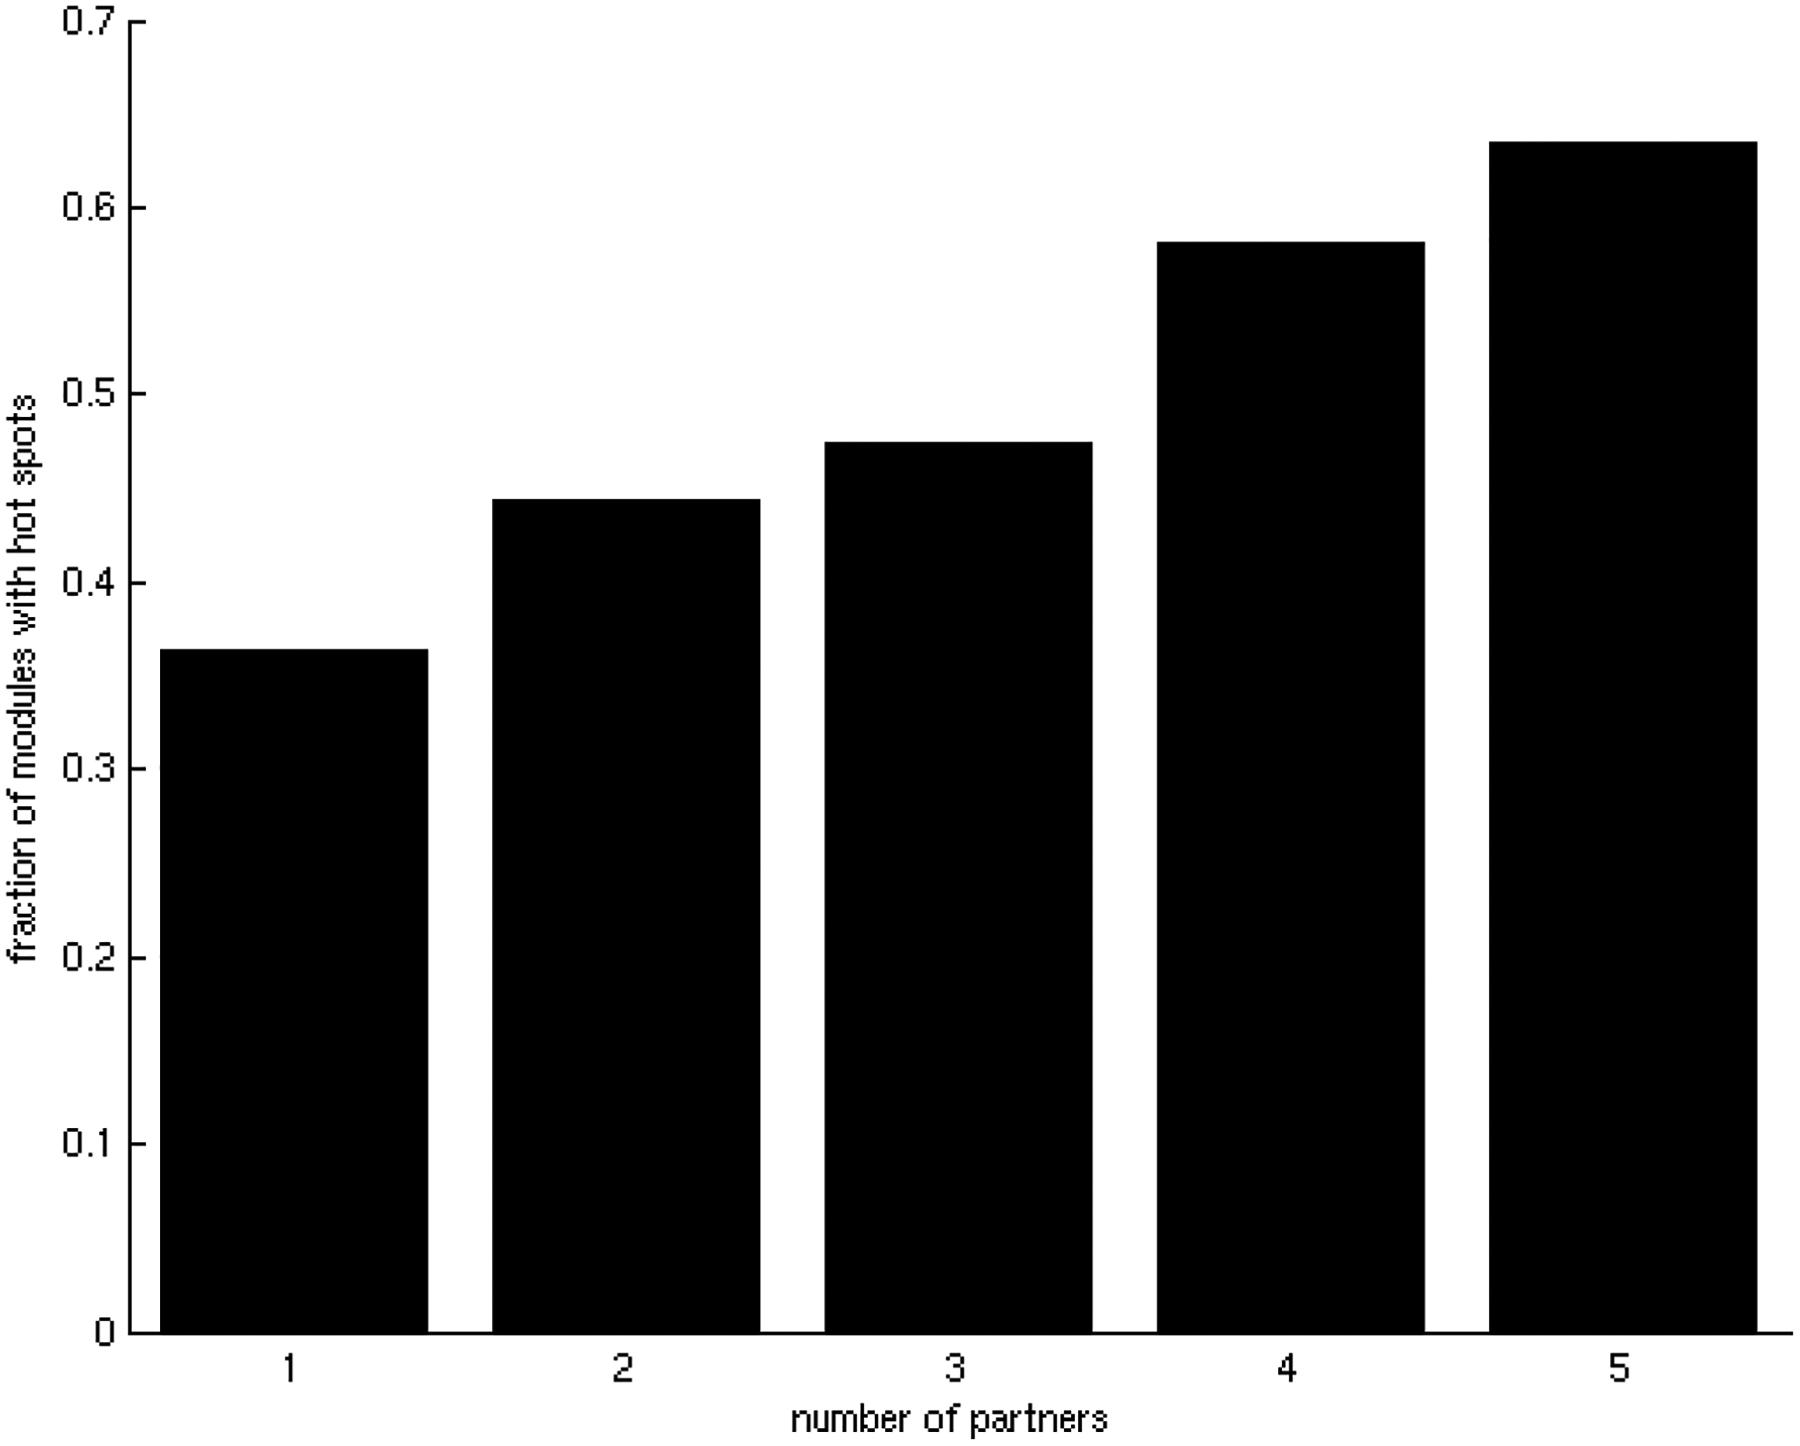
One of the challenges of the postgenomic era is to provide a more realistic representation of cellular processes by combining a systems biology description of functional networks with information on their interacting components. Here we carried out a systematic large-scale computational study on a structural protein-protein interaction network dataset in order to dissect thermodynamic characteristics of binding determining the interplay between protein affinity and specificity. As expected, interactions involving specific binding sites display higher affinities than those of promiscuous binding sites. Next, in order to investigate a possible role of modular distribution of hot spots in binding specificity, we divided binding sites into modules previously shown to be energetically independent. In general, hot spots that interact with different partners are located in different modules. We further observed that common hot spots tend to interact with partners exhibiting common binding motifs, whereas different hot spots tend to interact with partners with different motifs. Thus, energetic properties of binding sites provide insights into the way proteins modulate interactions with different partners. Knowledge of those factors playing a role in protein specificity is important for understanding how proteins acquire additional partners during evolution. It should also be useful in drug design.


Conflict of interest statement

The authors declare they have no conflict of interest.

Figures

Figure 1.
Figure 1.
Relationship between the number of interacting partners (specificity/promiscuity) and binding energy per residue (affinity). A) Binding energy per residue in binding sites averaged for different number of partners in binding sites. There is a clear tendency for the binding affinities to become weaker as the number of interacting partners of binding sites increases. B) Z-score frequency distribution of the correlation coefficients of 500 randomizations of the binding energies. In our dataset, the observed tendency, marked with a black triangle, has a statistically significant z-score = −2.17(p-value = 1.50 × 10⁻²).
Figure 1.
Figure 1.
Relationship between the number of interacting partners (specificity/promiscuity) and binding energy per residue (affinity). A) Binding energy per residue in binding sites averaged for different number of partners in binding sites. There is a clear tendency for the binding affinities to become weaker as the number of interacting partners of binding sites increases. B) Z-score frequency distribution of the correlation coefficients of 500 randomizations of the binding energies. In our dataset, the observed tendency, marked with a black triangle, has a statistically significant z-score = −2.17(p-value = 1.50 × 10⁻²).
Figure 2.
Figure 2.
Homogeneity in specificities of interactions. A) Z-score distribution of the percentage of specific-specific interactions found in 500 randomizations of the interacting partners. In the dataset, the observed percentage, marked with a black triangle, of specific-specific interactions is statistically significant (z-score = 2.8, p-value = 2.56 × 10⁻³). B) Z-score distribution of the percentage of promiscuous-promiscuous interactions found in 500 randomizations of the interacting partners. In the dataset, the observed percentage, marked with a black triangle, of promiscuous-promiscuous interactions is statistically significant (z-score = 2.2, p-value = 1.39 × 10⁻²).
Figure 2.
Figure 2.
Homogeneity in specificities of interactions. A) Z-score distribution of the percentage of specific-specific interactions found in 500 randomizations of the interacting partners. In the dataset, the observed percentage, marked with a black triangle, of specific-specific interactions is statistically significant (z-score = 2.8, p-value = 2.56 × 10⁻³). B) Z-score distribution of the percentage of promiscuous-promiscuous interactions found in 500 randomizations of the interacting partners. In the dataset, the observed percentage, marked with a black triangle, of promiscuous-promiscuous interactions is statistically significant (z-score = 2.2, p-value = 1.39 × 10⁻²).
Figure 3.
Figure 3.
Homogeneity in affinities of interactions of promiscuous binding sites. A) Distribution of the differences between binding affinities corresponding to interactions occurring through the same binding site. Energy differences between partners are mainly distributed between 0 and 0.2 kcal/mol per residue. B) Random test for homogeneity of affinities of the interactions. The distribution of energy differences between interactions occurring through distinct binding sites is centered at 0.5 kcal/mol per residue.
Figure 3.
Figure 3.
Homogeneity in affinities of interactions of promiscuous binding sites. A) Distribution of the differences between binding affinities corresponding to interactions occurring through the same binding site. Energy differences between partners are mainly distributed between 0 and 0.2 kcal/mol per residue. B) Random test for homogeneity of affinities of the interactions. The distribution of energy differences between interactions occurring through distinct binding sites is centered at 0.5 kcal/mol per residue.
Figure 4.
Figure 4.
Overlap of binding sites hot spots. Frequency distribution of predicted hot spot residues in promiscuous binding sites respect to the number of interactions where they act as hot spots. Only 18% of residues were predicted as hot spots in two interactions, and approximately 6% in more than two interactions.
Figure 5.
Figure 5.
Relationship between the averaged fraction of modules with hot spots and specificity in the binding sites. A) Relationship between the averaged fraction of modules containing hot spots in binding sites and specificity. There is a clear tendency for the modular distribution of hot spots to increase with binding site promiscuity. B) Z-score frequency distribution of the correlation coefficients for 500 randomizations of the binding energies. In the dataset of this study, the tendency, marked with a black triangle, was found to have a statistically significant z-score = 5.24 (p-value = 8.03 × 10⁻⁸).
Figure 5.
Figure 5.
Relationship between the averaged fraction of modules with hot spots and specificity in the binding sites. A) Relationship between the averaged fraction of modules containing hot spots in binding sites and specificity. There is a clear tendency for the modular distribution of hot spots to increase with binding site promiscuity. B) Z-score frequency distribution of the correlation coefficients for 500 randomizations of the binding energies. In the dataset of this study, the tendency, marked with a black triangle, was found to have a statistically significant z-score = 5.24 (p-value = 8.03 × 10⁻⁸).
Figure 6.
Figure 6.
Different examples of modular distribution of hot spots in promiscuous and specific binding sites. A) Example of promiscuous binding site with specific hot spots to different interactions, which are located in different modules. Predicted hot spots are shown in red ball and stick representation in a promiscuous binding site (cpk residues) of ubiquitin (YLR167W). The modular decomposition of the protein structure is represented by colors. The binding site is divided into four modules (yellow, blue, green, dark blue), three of them containing hot spots (F4; I44,F45; R42,R72,L73,L74), which are energetic determinants in specific interactions: a) YMR276W (F4), PDB: 1p3q V U (dark blue); b) YEL037C (I44,F45), PDB: 1gjz A B (green); c) YOR124C (R42,R72,L73,L74), PDB: 1nbf C B (yellow). PDB template for ubiquitin: 1nbf C. B) Example of promiscuous binding site with specific and common hot spots to different interactions. Specific and common hot spots are located in different modules. Predicted hot spots are shown in red ball and stick representation in a promiscuous binding site (cpk residues) of cdc42 (YLR229C). The modular decomposition of the protein structure is represented by colors. The binding site is divided into five modules (crimson, purple, blue, dark blue, yellow), two of them containing hot spots (D63,Y64,R66,L67,L70;T35), and participate as hot spots in different combination for the partners: a) YDL135C (D63,Y64,R66,L67,L70;T35), PDB: 1doa A B (dark blue); b) YDL240W (D63,Y64,R66,L67,L70), PDB: 2ngr A B (orange). PDB template for cdc42: 1kz7 B. C) Example of specific binding site with hot spots contained in one module. Predicted hot spots are shown in ball and stick representation in a specific binding site of cytochrome b (Q0105), which interacts specifically with the Rieske iron-sulfur protein (YEL024W). The modular decomposition of the protein structure is represented by colors. The binding site is divided into two modules (dark green, light blue). Hot spots are located in a central dark green module (W163,F168,R177,L262), PDB: 2a06 P E (orange). PDB template for cytochrome b: 2bcc C. D) Example of specific binding site with hot spots contained in one module. Predicted hot spots are shown in ball and stick representation in a specific binding site of cmk2 (YOL016C), which interacts specifically with akr1 (YDR264C). The modular decomposition of the protein structure is represented by colors. The binding site is divided into four modules (green, dark red, purple, yellow). The four predicted hot spots are located in the central green module (R31,F39,D102), PDB: 1bi8 A B (orange). PDB template for cmk2: 1bi8 A.
Figure 6.
Figure 6.
Different examples of modular distribution of hot spots in promiscuous and specific binding sites. A) Example of promiscuous binding site with specific hot spots to different interactions, which are located in different modules. Predicted hot spots are shown in red ball and stick representation in a promiscuous binding site (cpk residues) of ubiquitin (YLR167W). The modular decomposition of the protein structure is represented by colors. The binding site is divided into four modules (yellow, blue, green, dark blue), three of them containing hot spots (F4; I44,F45; R42,R72,L73,L74), which are energetic determinants in specific interactions: a) YMR276W (F4), PDB: 1p3q V U (dark blue); b) YEL037C (I44,F45), PDB: 1gjz A B (green); c) YOR124C (R42,R72,L73,L74), PDB: 1nbf C B (yellow). PDB template for ubiquitin: 1nbf C. B) Example of promiscuous binding site with specific and common hot spots to different interactions. Specific and common hot spots are located in different modules. Predicted hot spots are shown in red ball and stick representation in a promiscuous binding site (cpk residues) of cdc42 (YLR229C). The modular decomposition of the protein structure is represented by colors. The binding site is divided into five modules (crimson, purple, blue, dark blue, yellow), two of them containing hot spots (D63,Y64,R66,L67,L70;T35), and participate as hot spots in different combination for the partners: a) YDL135C (D63,Y64,R66,L67,L70;T35), PDB: 1doa A B (dark blue); b) YDL240W (D63,Y64,R66,L67,L70), PDB: 2ngr A B (orange). PDB template for cdc42: 1kz7 B. C) Example of specific binding site with hot spots contained in one module. Predicted hot spots are shown in ball and stick representation in a specific binding site of cytochrome b (Q0105), which interacts specifically with the Rieske iron-sulfur protein (YEL024W). The modular decomposition of the protein structure is represented by colors. The binding site is divided into two modules (dark green, light blue). Hot spots are located in a central dark green module (W163,F168,R177,L262), PDB: 2a06 P E (orange). PDB template for cytochrome b: 2bcc C. D) Example of specific binding site with hot spots contained in one module. Predicted hot spots are shown in ball and stick representation in a specific binding site of cmk2 (YOL016C), which interacts specifically with akr1 (YDR264C). The modular decomposition of the protein structure is represented by colors. The binding site is divided into four modules (green, dark red, purple, yellow). The four predicted hot spots are located in the central green module (R31,F39,D102), PDB: 1bi8 A B (orange). PDB template for cmk2: 1bi8 A.

References

    1. He X, Zhang J, Why do hubs tend to be essential in protein networks? PLoS Genet. 2006, 2, e88. - PMC - PubMed
    1. Beckett D, Multilevel regulation of protein-protein interactions in biological circuitry. Phys Biol. 2005, 2, S67–73. - PubMed
    1. Kuriyan J, Eisenberg D, The origin of protein interactions and allostery in colocalization. Nature 2007, 450, 983–990. - PubMed
    1. Han JD, Bertin N, Hao T, Goldberg DS et al., Evidence for dynamically organized modularity in the yeast protein-protein interaction network. Nature 2004, 430, 88–93. - PubMed
    1. Kim PM, Lu LJ, Xia Y, Gerstein MB, Relating three-dimensional structures to protein networks provides evolutionary insights. Science 2006, 314, 1938–1941. - PubMed

Publication types

MeSH terms

LinkOut - more resources