

New bioinformatics approach to analyze gene expressions and signaling pathways reveals unique purine gene dysregulation profiles that distinguish between CD and UC
- PMID: 19253308
- PMCID: PMC2697273
- DOI: 10.1002/ibd.20893
New bioinformatics approach to analyze gene expressions and signaling pathways reveals unique purine gene dysregulation profiles that distinguish between CD and UC
Abstract
Background: Expression of purine genes is modulated by inflammation or experimental colitis and altered expression leads to disrupted gut function. We studied purine gene dysregulation profiles in inflammatory bowel disease (IBD) and determined whether they can distinguish between Crohn's disease (CD) and ulcerative colitis (UC) using Pathway Analysis and a new Comparative Analysis of Gene Expression and Selection (CAGES) method.
Methods: Raw datasets for 22 purine genes and 36 probe-sets from National Center for Biotechnology Information (NCBI) GEO (Gene Expression Omnibus) (http://www.ncbi.nlm.nih.gov/projects/geo/) were analyzed by National Cancer Institute (NCI) Biological Resources Branch (BRB) array tools for random-variance of multiple/36 t-tests in colonic mucosal biopsies or peripheral blood mononuclear cells (PBMCs) of CD, UC or control subjects. Dysregulation occurs in 59% of purine genes in IBD including ADORA3, CD73, ADORA2A, ADORA2B, ADAR, AMPD2, AMPD3, DPP4, P2RY5, P2RY6, P2RY13, P2RY14, and P2RX5.
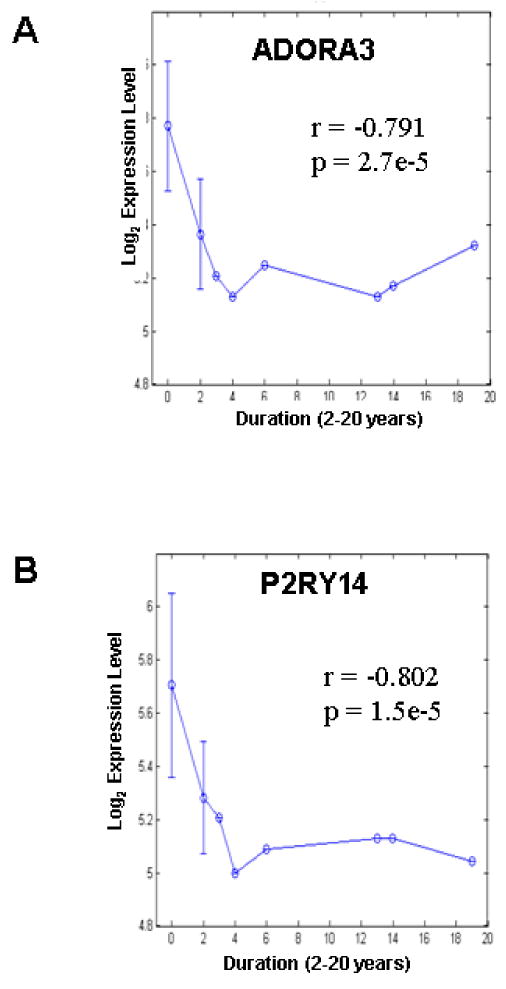
Results: In CD biopsies, expression of ADORA3, AMPD3, P2RY13, and P2RY5 were negatively correlated with acute inflammatory score, Crohn's Disease Activity Index (CDAI) or disease chronicity; P2RY14 was positively correlated in UC. In mucosal biopsies or PBMCs, CD and UC were distinguished by unique patterns of dysregulation (up- or downregulation) in purine genes. Purine gene dysregulation differs between PBMCs and biopsies and possibly between sexes for each disease. Ingenuity Pathway Analysis (IPA) revealed significant associations between alterations in the expression of CD73 (upregulation) or ADORA3 (downregulation) and inflammatory or purine genes (<or=10% of 57 genes) as well as G-protein coupled receptors, cAMP-dependent, and inflammatory pathways; IPA distinguishes CD from UC.
Conclusion: CAGES and Pathway Analysis provided novel evidence that UC and CD have distinct purine gene dysregulation signatures in association with inflammation, cAMP, or other signaling pathways. Disease-specific purine gene signature profiles and pathway associations may be of therapeutic, diagnostic, and functional relevance.
Figures


Similar articles
-
Nitric oxide pathway-related gene alterations in inflammatory bowel disease.Scand J Gastroenterol. 2012 Nov;47(11):1283-97. doi: 10.3109/00365521.2012.706830. Epub 2012 Aug 20. Scand J Gastroenterol. 2012. PMID: 22900953
-
Inflammatory gene expression profiles in Crohn's disease and ulcerative colitis: a comparative analysis using a reverse transcriptase multiplex ligation-dependent probe amplification protocol.J Crohns Colitis. 2013 Sep;7(8):622-30. doi: 10.1016/j.crohns.2012.08.015. Epub 2012 Sep 24. J Crohns Colitis. 2013. PMID: 23014361
-
Expression of Programmed Death-Ligand 1 by Human Colonic CD90+ Stromal Cells Differs Between Ulcerative Colitis and Crohn's Disease and Determines Their Capacity to Suppress Th1 Cells.Front Immunol. 2018 May 30;9:1125. doi: 10.3389/fimmu.2018.01125. eCollection 2018. Front Immunol. 2018. PMID: 29910803 Free PMC article.
-
Differentiating ulcerative colitis from Crohn disease in children and young adults: report of a working group of the North American Society for Pediatric Gastroenterology, Hepatology, and Nutrition and the Crohn's and Colitis Foundation of America.J Pediatr Gastroenterol Nutr. 2007 May;44(5):653-74. doi: 10.1097/MPG.0b013e31805563f3. J Pediatr Gastroenterol Nutr. 2007. PMID: 17460505
-
Inflammatory bowel diseases: controversies in the use of diagnostic procedures.Dig Dis. 2009;27(3):269-77. doi: 10.1159/000228560. Epub 2009 Sep 24. Dig Dis. 2009. PMID: 19786751 Review.
Cited by
-
The Purinergic System as a Pharmacological Target for the Treatment of Immune-Mediated Inflammatory Diseases.Pharmacol Rev. 2019 Jul;71(3):345-382. doi: 10.1124/pr.117.014878. Pharmacol Rev. 2019. PMID: 31235653 Free PMC article. Review.
-
Purinergic autocrine regulation of mechanosensitivity and serotonin release in a human EC model: ATP-gated P2X3 channels in EC are downregulated in ulcerative colitis.Inflamm Bowel Dis. 2013 Oct;19(11):2366-79. doi: 10.1097/MIB.0b013e31829ecf4d. Inflamm Bowel Dis. 2013. PMID: 23917247 Free PMC article.
-
Circulating microRNAs as biomarkers for inflammatory diseases.Microrna. 2013;2(1):63-71. doi: 10.2174/2211536611302010007. Microrna. 2013. PMID: 25019052 Free PMC article. Review.
-
Identification of an IL-22-Dependent Gene Signature as a Pharmacodynamic Biomarker.Int J Mol Sci. 2021 Jul 30;22(15):8205. doi: 10.3390/ijms22158205. Int J Mol Sci. 2021. PMID: 34360971 Free PMC article.
-
Potential for developing purinergic drugs for gastrointestinal diseases.Inflamm Bowel Dis. 2014 Jul;20(7):1259-87. doi: 10.1097/MIB.0000000000000047. Inflamm Bowel Dis. 2014. PMID: 24859298 Free PMC article. Review.
References
-
- Marak GE, Jr, de Kozak Y, Faure JP, et al. Pharmacologic modulation of acute ocular inflammation I Adenosine. Ophthalmic Res. 1988;20:220–226. - PubMed
-
- Schrier DJ, Lesch ME, Wright CD, et al. The anti-inflammatory effects of adenosine receptor agonists on the carrageenan-induced pleural inflammatory response in rats. J Immunol. 1990;145:1874–1879. - PubMed
-
- Hasko G, Szabo C. Regulation of cytokine and chemokine production by transmitters and co-transmitters of the autonomic nervous system. Biochem Pharmacol. 1998;56:1079–1087. - PubMed
-
- Hasko G, Kuhel DG, Chen JF, et al. Adenosine inhibits IL-12 and TNF-alpha production via adenosine A2a receptor-dependent and independent mechanisms. FASEB J. 2000;14:2065–2074. - PubMed
Publication types
MeSH terms
Substances
Grants and funding
LinkOut - more resources
Full Text Sources
Other Literature Sources
Medical
Research Materials
Miscellaneous