. 2009 Mar;23(2):255-64.
doi: 10.1037/a0012850.

Comparisons of methods for multiple hypothesis testing in neuropsychological research

Affiliations

Comparisons of methods for multiple hypothesis testing in neuropsychological research

Richard E Blakesley et al. Neuropsychology. 2009 Mar.

Abstract

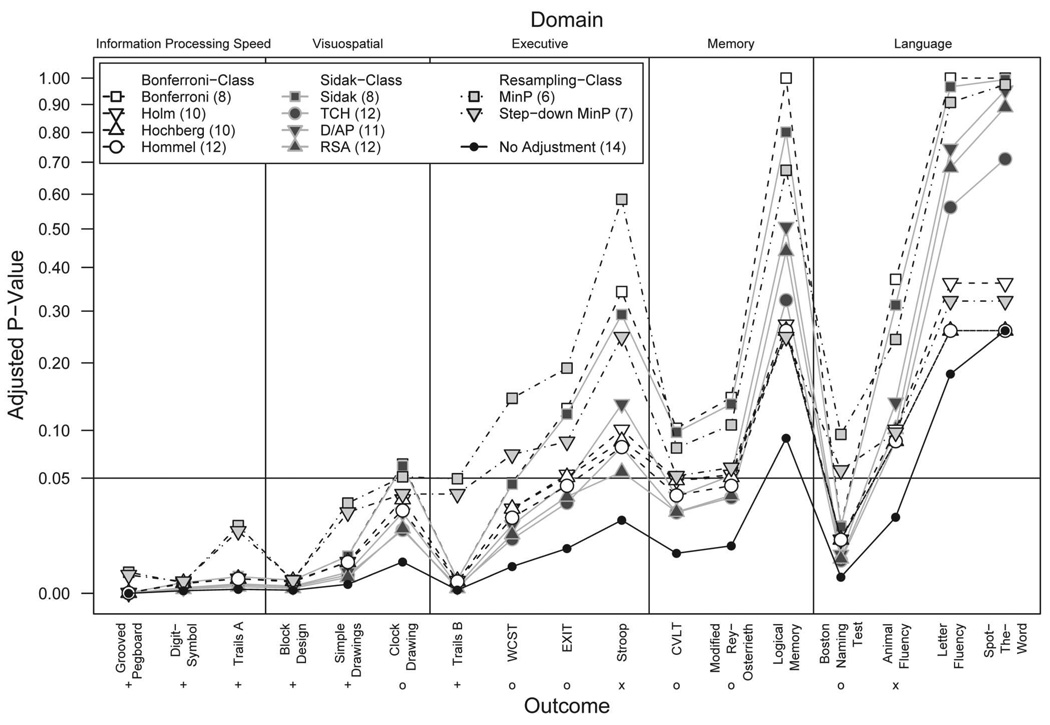
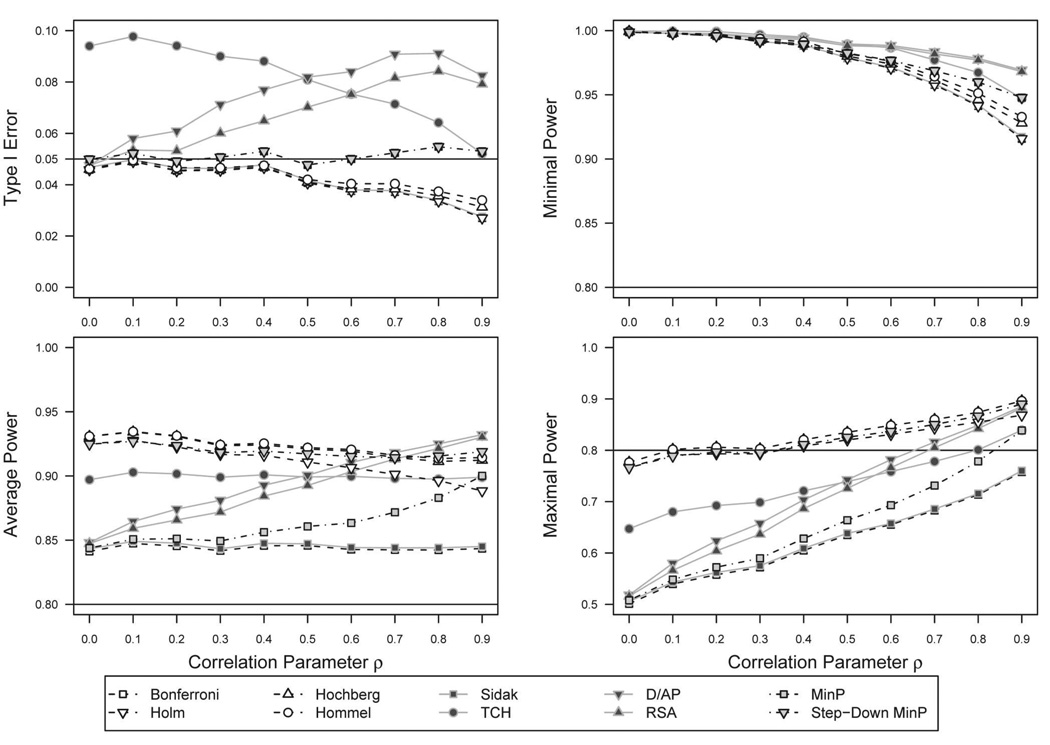
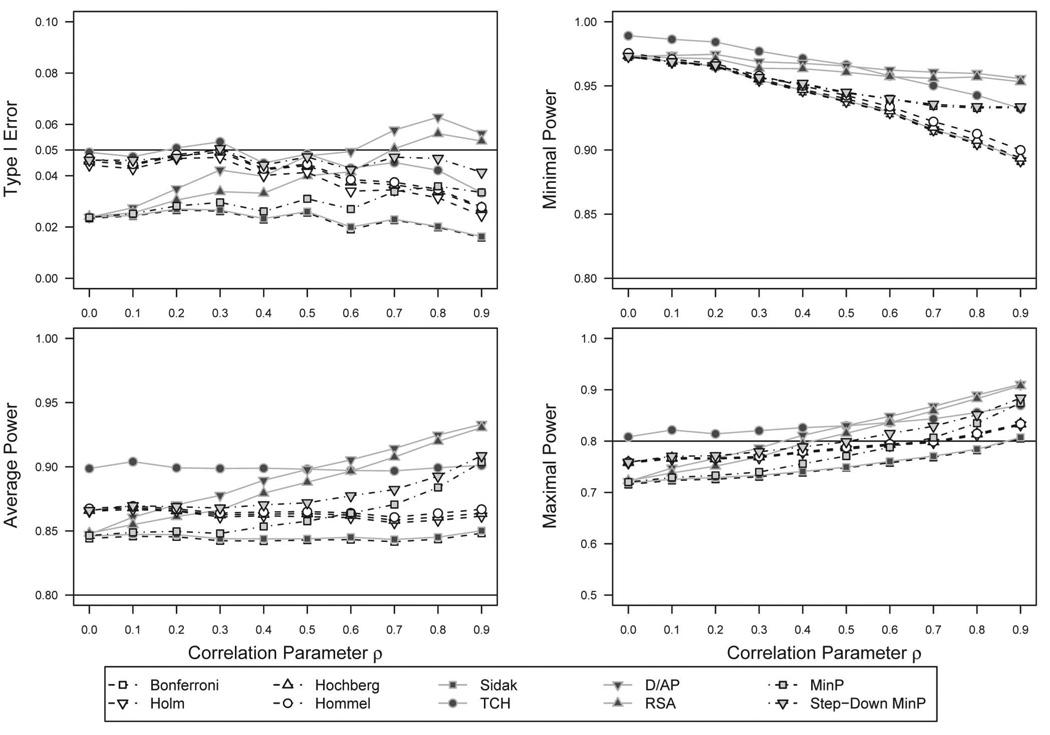
Hypothesis testing with multiple outcomes requires adjustments to control Type I error inflation, which reduces power to detect significant differences. Maintaining the prechosen Type I error level is challenging when outcomes are correlated. This problem concerns many research areas, including neuropsychological research in which multiple, interrelated assessment measures are common. Standard p value adjustment methods include Bonferroni-, Sidak-, and resampling-class methods. In this report, the authors aimed to develop a multiple hypothesis testing strategy to maximize power while controlling Type I error. The authors conducted a sensitivity analysis, using a neuropsychological dataset, to offer a relative comparison of the methods and a simulation study to compare the robustness of the methods with respect to varying patterns and magnitudes of correlation between outcomes. The results lead them to recommend the Hochberg and Hommel methods (step-up modifications of the Bonferroni method) for mildly correlated outcomes and the step-down minP method (a resampling-based method) for highly correlated outcomes. The authors note caveats regarding the implementation of these methods using available software.


Figures

Figure 1
Figure 1
Adjusted p values by method across neuropsychological outcomes. There are 17 observed p values for a set of 17 neuropsychological measures and adjusted p values per each method. A square-root scale is used to reduce overlapping points. Numbers in parentheses in the legend indicate the number of rejected hypotheses for that method. Symbols for outcomes with a null hypothesis rejected without adjustment indicate the following: + = null hypothesis rejected using each adjustment method; x = null hypothesis not rejected using any adjustment method; o = null hypothesis rejected by some adjustment methods. A full color version of this figure is included in the supplemental materials online.
Figure 2
Figure 2
p value adjustment method performance across compound-symmetry correlation structures, Type I error, and power estimates for uniform hypothesis set. The upper left panel shows Type I error rates of the p value adjustment methods across increasing values of the compound-symmetry correlation parameter ρ. In this case, all M = 4 hypotheses are simulated to be true. Values near α = .05 are optimal. Values well above α = .05 indicate failure to protect Type I error at α. The remaining panels show different measures of power, where the four hypotheses are simulated to be false. Higher power is optimal, conditional on Type I error not exceeding α. A full color version of this figure is included in the supplemental materials online.
Figure 3
Figure 3
p value adjustment method performance across compound-symmetry correlation structures, Type I error, and power estimates for split hypothesis set. The upper left panel shows Type I error rates of the p value adjustment methods across increasing values of the CS correlation parameter ρ. In this case, all only two of the M = 4 hypotheses are simulated to be true. Values near α = .05 are optimal. Values well above α = .05 indicate failure to protect Type I error at α. The remaining panels show different measures of power, using the two hypotheses simulated to be false. Higher power is optimal, conditional on Type I error not exceeding α. A full color version of this figure is included in the supplemental materials online.

Similar articles

Cited by

References

    1. Butters MA, Whyte EM, Nebes RD, Begley AE, Dew MA, Mulsant BH, et al. The nature and determinants of neuropsychological functioning in late-life depression. Archives of General Psychiatry. 2004;61:587–595. - PubMed
    1. Dudoit S, Shaffer JP, Boldrick JC. Multiple hypothesis testing in microarray experiments. Statistical Science. 2003;18:71–103.
    1. Dunnett CW, Tamhane AC. A step-up multiple test procedure. Journal of the American Statistical Association. 1992;87:162–170.
    1. Hochberg Y. A sharper Bonferroni procedure for multiple tests of significance. Biometrika. 1988;75:800–802.
    1. Hochberg Y, Benjamini Y. More powerful procedures for multiple significance testing. Statistics in Medicine. 1990;9:811–818. - PubMed

Publication types