. 2009 Apr;42(2):248-63.
doi: 10.1111/j.1365-2184.2009.00586.x. Epub 2009 Feb 27.

A novel view on stem cell development: analysing the shape of cellular genealogies

Affiliations

A novel view on stem cell development: analysing the shape of cellular genealogies

I Glauche et al. Cell Prolif. 2009 Apr.

Abstract

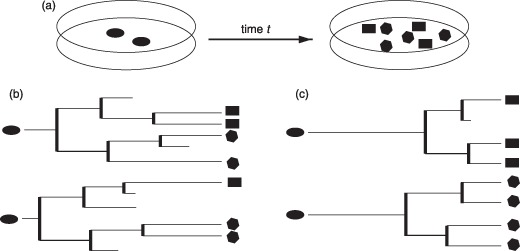
Objectives: The analysis of individual cell fates within a population of stem and progenitor cells is still a major experimental challenge in stem cell biology. However, new monitoring techniques, such as high-resolution time-lapse video microscopy, facilitate tracking and quantitative analysis of single cells and their progeny. Information on cellular development, divisional history and differentiation are naturally comprised into a pedigree-like structure, denoted as cellular genealogy. To extract reliable information concerning effecting variables and control mechanisms underlying cell fate decisions, it is necessary to analyse a large number of cellular genealogies.

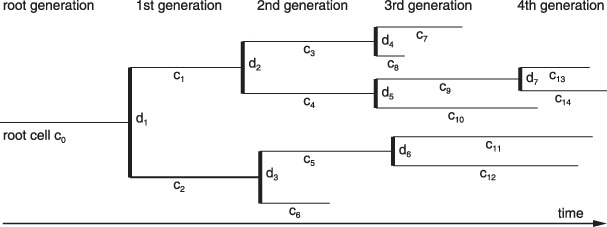
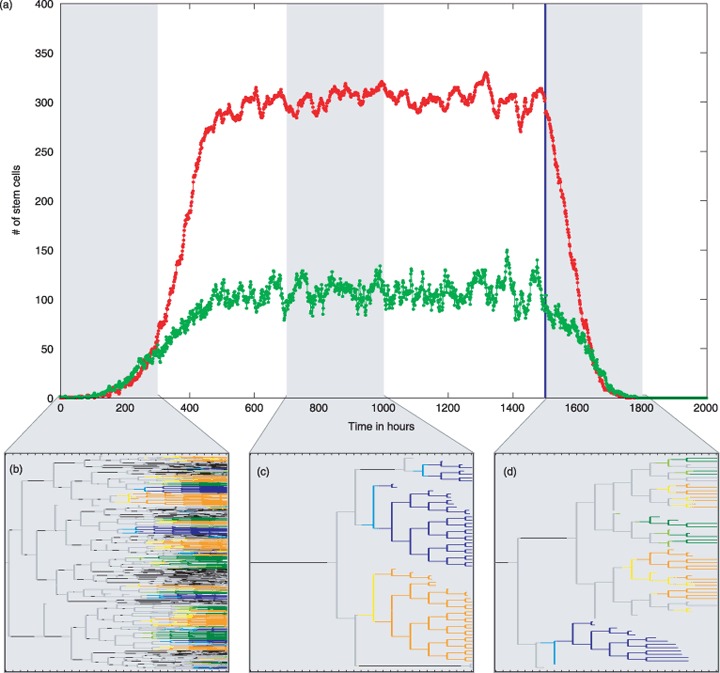
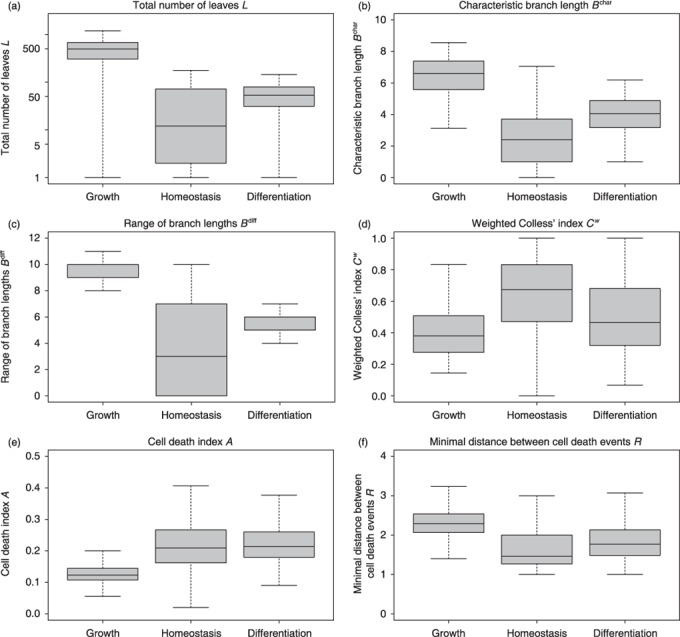
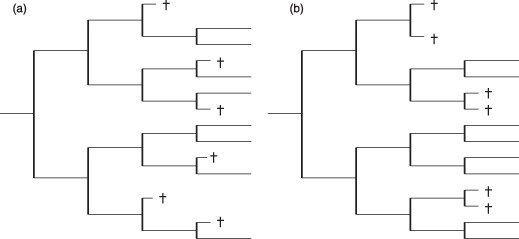
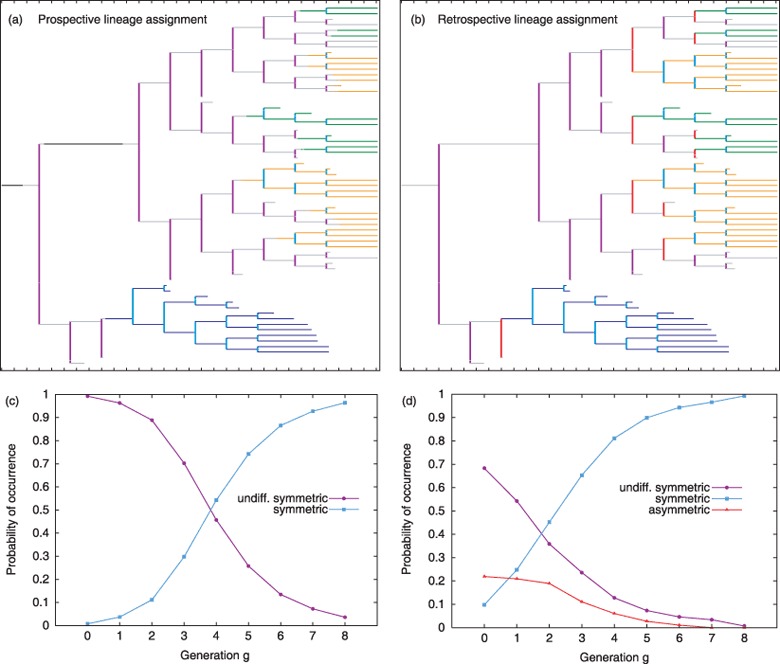
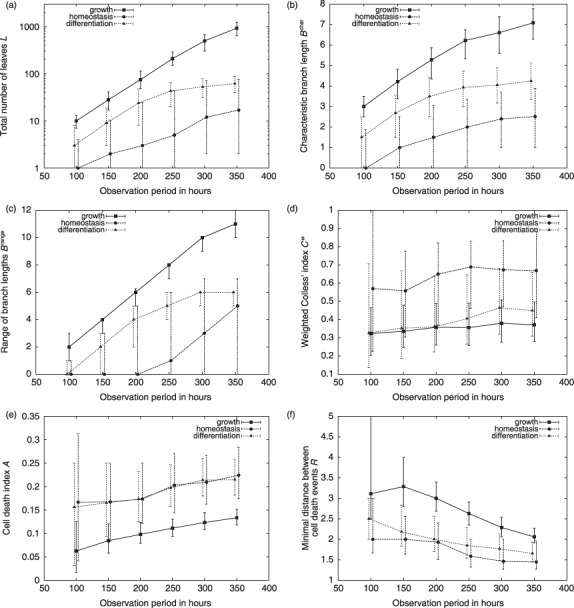
Materials and methods: Here, we propose a set of statistical measures that are specifically tailored for the analysis of cellular genealogies. These measures address the degree and symmetry of cellular expansion, as well as occurrence and correlation of characteristic events such as cell death. Furthermore, we discuss two different methods for reconstruction of lineage fate decisions and show their impact on the interpretation of asymmetric developments. In order to illustrate these techniques, and to circumvent the present shortage of available experimental data, we obtain cellular genealogies from a single-cell-based mathematical model of haematopoietic stem cell organization.

Results and conclusions: Based on statistical analysis of cellular genealogies, we conclude that effects of external variables, such as growth conditions, are imprinted in their topology. Moreover, we demonstrate that it is essential to analyse timing of cell fate-specific changes and of occurrence of cell death events in the divisional context in order to understand the mechanisms of lineage commitment.


Figures

Figure 1
Figure 1
Cell cultures and genealogies. (a) Shows a typical cell culture experiment in which undifferentiated cells are exposed to certain conditions, and the final composition is evaluated after time t (possible changes of the cell fate are indicated by the shape of the sketched cells). Within this setup, it is not possible to analyse whether the initial cells contributed to more than one cell fate or whether there is an inherent predetermination of these cells. Furthermore, this approach does neither elucidate the role of cell death nor the timing of the expansion. The cellular genealogies shown in subfigure (b) and (c) represent two possible and rather distinct scenarios that match the above population results. Genealogies in (b) are characterized by early expansion, multipotency (initial cells contribute to more than one lineage fate) and significant cell death. In contrast, the genealogies in (c) show late expansion, unipotency (initial cells only contribute to one lineage fate) and reduced cell death.
Figure 2
Figure 2
Schematic sketch of a cellular genealogy. Within the given five generation genealogies, the thin horizontal lines represent cells ci whereas the divisions dj are marked by the thick vertical bars. The horizontal dimension is time t with the founding root cell c 0 indicated on the left hand side. Thus, the length of the horizontal lines represents duration of the cell's existence and is a measure of the cell‐cycle time (T C). Final cells on the right hand side are called leaf cells. The degree of relation rpq between any two cells cp and cq is given by the number of divisions between cells cp and cq. For example, cells c 6 and c 8 have a degree of relation r 6,8 = 4 (separated by the divisions d 3, d 1, d 2, and d 4). Using the same measure of relation the branch length from the root c 0 to the leaf cells is determined. For the particular example, the longest branch is r 0,14 = 4 and the shortest branch is r 0,6 = 2.
Figure 3
Figure 3
Populations dynamics for the three different scenarios and corresponding cellular genealogies. (a) Given are the simulated numbers of proliferating (green) and quiescent (red) stem cells. At time point t = 0, the cell culture is initialized by a single stem cells that subsequently undergoes massive expansion. The corresponding growth scenario is indicated by the first shaded area. Within this observation period of 300 h the cellular genealogies of 400 initial cells are tracked in independent realizations. Around t = 600 the system reaches a stable equilibrium with about 100 proliferating and about 300 quiescent stem cells. For the cellular genealogies of the homeostatic scenario, all stem cells present at time point t = 700 are uniquely marked and subsequently tracked for 300 h. This is indicated by the second shaded area. By changing differentiation and regeneration parameters at time t = 1500 (blue line), the self‐renewal ability of the stem cells is lost and they undergo terminal differentiation (differentiation scenario). As in the homeostatic scenario, cellular genealogies are derived by marking all stem cells present at time point t = 1500 prior to the change of parameters and their subsequent tracking for 300 h (third shaded area). (b)–(d) A characteristic genealogy for each scenario is given below the main graph (b, growth scenario; c, homeostatic scenario; d, differentiation scenario). Colours indicate cell‐cycle status of the undifferentiated cells and commitment to three possible lineages for differentiating cells: grey – undifferentiated proliferating cell; black – undifferentiated quiescent cell; yellow/orange – early/finally committed cell of the ‘orange lineage’; light/dark blue – early/finally committed cell of the ‘blue lineage’; light/dark green – early/finally committed cell of the ‘green lineage’.
Figure 4
Figure 4
Characteristic measures of tree shape. Shown are box plots of distributions for the topological measures proposed in the Results section. (a) total number of leaves L (shown on a logarithmic scale) (b) characteristic branch lengths B char (c) range of branch lengths B range (d) weighted Colless’ index Cw (e) cell death index A (f) minimal distance between cell death events R. Median values are shown by the thick bars, boxes correspond to the first and third quartile. Whiskers extend to the most extreme data point which is no more than 1.5 times the interquartile range from the box. Detailed histograms of distributions are provided in the Supporting Information.
Figure 5
Figure 5
Mutual relation between cell death events. (a) and (b) show two examples of topologically similar cellular genealogies (L = 14, B char = 3.75, B range = 1, C = 0.05, A3 = 1/4, A4 = 1/3 for both genealogies, Cw = 0.068 (a) and Cw = 0.136 (b)). However, despite these similarities they differ considerably with respect to occurrence of cell death events. Whereas in (a) the cell death events are rather isolated, they always appear in sibling cells in (b). The mutual information measures MIg and the minimal distance R are suitable measures to account for these correlations: (a) MI 3 = 0.036, MI 4 = 0.076, R = 3; (b) MI 3 = 0.244, MI 4 = 0.276, R = 1.
Figure 6
Figure 6
Prospective vs. retrospective view for the lineage assignment. (a) Lineage fate is assigned in situ for a chosen cellular genealogy of the differentiation scenario in the prospective view, e.g. ‘the colour coding’ of a cell might change during the cells existence if certain critical markers (lineage propensities in the simulation model) exceed a threshold level. In contrast, in subfigure (b) Lineage fate is assigned recursively based on the lineage fate of the daughter cells for the same genealogy as in subfigure (a). Colour‐coding of the cells is identical to Fig. 3 (neglecting the early committed stages), colours for the divisions are assigned as follows: undifferentiated symmetric divisions – magenta, symmetric divisions of committed cells – light blue, asymmetric divisions (only in the retrospective view) – red. In (c) and (d), the probability of occurrence of the particular division types for each generation g is given for the set of genealogies derived under the differentiation scenario. The colour‐coding is identical to (a) and (b).
Figure 7
Figure 7
Scaling behaviour of the characteristic measures of tree shape. Median (dots) and first and third quartiles (error bars) are shown for the distributions of the topological measures proposed in the Results section as a function of the observation period (ranging from 100 h to 350 h, shown on the x‐axis) (a) total number of leaves L (shown on a logarithmic scale), (b) characteristic branch lengths B char, (c) range of branch lengths B range, (d) weighted Colless’ index Cw, (e) cell death index A and (f) minimal distance between cell death events R.

References

    1. Schroeder T (2005) Tracking hematopoiesis at the single cell level. Ann. N Y Acad. Sci. 1044, 201–209. - PubMed
    1. Roeder I, Lorenz R (2006) Asymmetry of stem cell fate and the potential impact of the niche: observations, simulations, and interpretations. Stem Cell Rev. 2, 171–180. - PubMed
    1. Morrison SJ, Shah NM, Anderson DJ (1997) Regulatory mechanisms in stem cell biology. Cell 88, 287–298. - PubMed
    1. Soneji S, Huang S, Loose M, Donaldson IJ, Patient R, Göttgens B, Enver T, May G (2007) Inference, validation, and dynamic modeling of transcription networks in multipotent hematopoietic cells. Ann. N Y Acad. Sci. 1106, 30–40. - PubMed
    1. Dykstra B, Ramunas J, Kent D, McCaffrey L, Szumsky E, Kelly L, Farn K, Blaylock A, Eaves C, Jervis E (2006) High‐resolution video monitoring of hematopoietic stem cells cultured in single‐cell arrays identifies new features of self‐renewal. Proc. Natl Acad. Sci. USA 103, 8185–8190. - PMC - PubMed

Publication types