. 2009 Mar 2:10:96.
doi: 10.1186/1471-2164-10-96.

Mapping QTL influencing gastrointestinal nematode burden in Dutch Holstein-Friesian dairy cattle

Affiliations

Mapping QTL influencing gastrointestinal nematode burden in Dutch Holstein-Friesian dairy cattle

Wouter Coppieters et al. BMC Genomics. .

Abstract

Background: Parasitic gastroenteritis caused by nematodes is only second to mastitis in terms of health costs to dairy farmers in developed countries. Sustainable control strategies complementing anthelmintics are desired, including selective breeding for enhanced resistance.

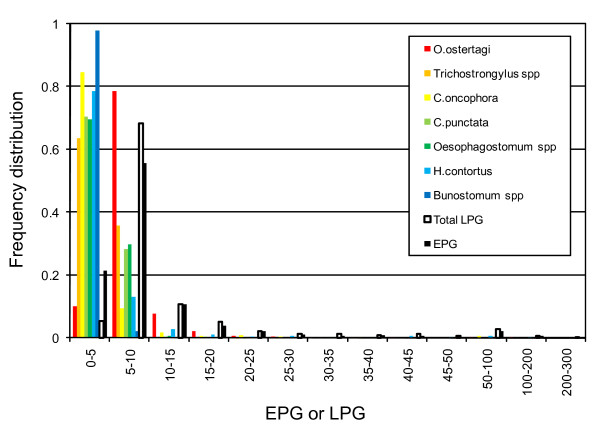
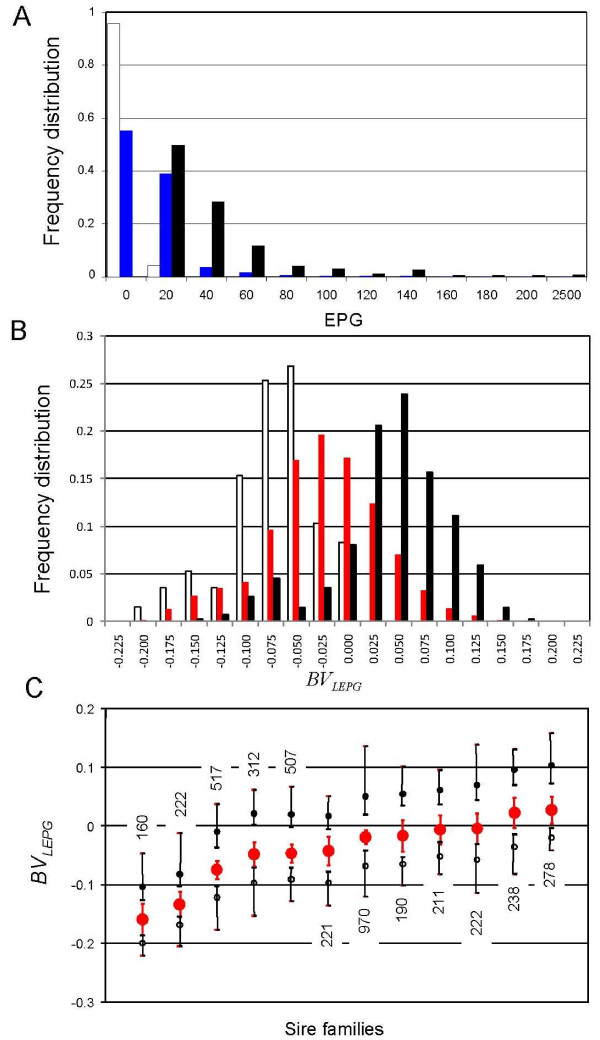
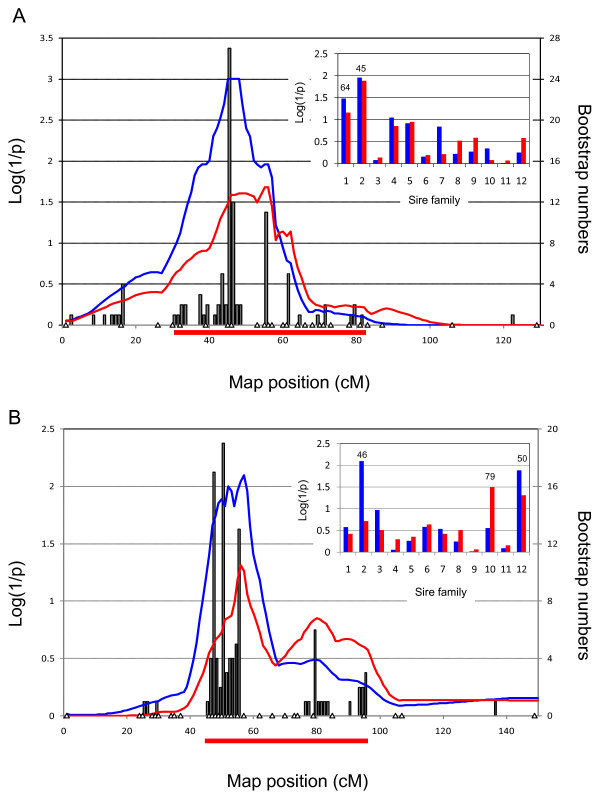
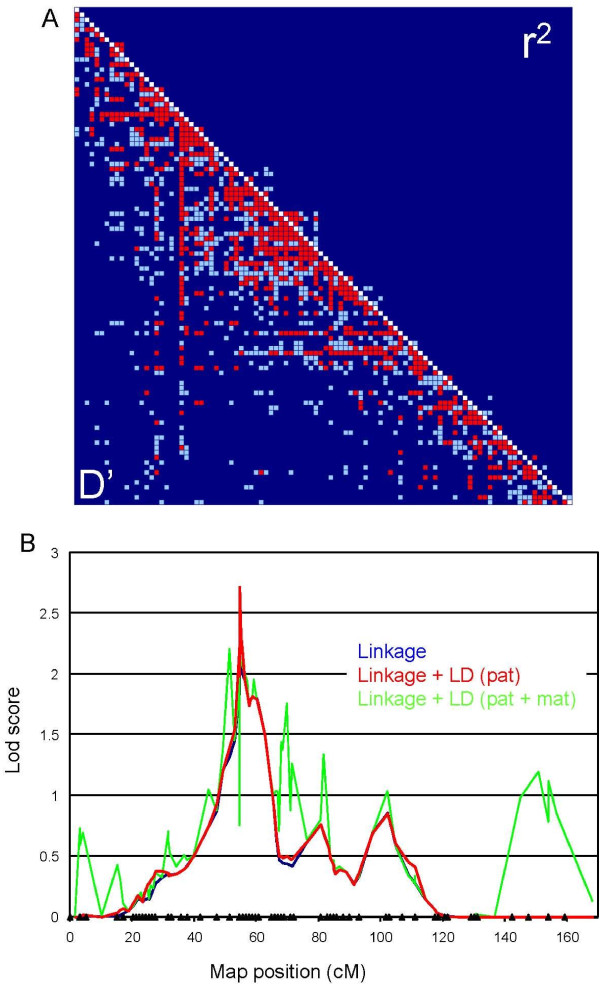
Results and conclusion: To quantify and characterize the genetic contribution to variation in resistance to gastro-intestinal parasites, we measured the heritability of faecal egg and larval counts in the Dutch Holstein-Friesian dairy cattle population. The heritability of faecal egg counts ranged from 7 to 21% and was generally higher than for larval counts. We performed a whole genome scan in 12 paternal half-daughter groups for a total of 768 cows, corresponding to the approximately 10% most and least infected daughters within each family (selective genotyping). Two genome-wide significant QTL were identified in an across-family analysis, respectively on chromosomes 9 and 19, coinciding with previous findings in orthologous chromosomal regions in sheep. We identified six more suggestive QTL by within-family analysis. An additional 73 informative SNPs were genotyped on chromosome 19 and the ensuing high density map used in a variance component approach to simultaneously exploit linkage and linkage disequilibrium in an initial inconclusive attempt to refine the QTL map position.


Figures

Figure 1
Figure 1
Frequency distribution of the number of genus/species-specific larvae per gram of faeces (coloured bars) and number of nematode eggs per gram of faeces (EPG, black bar) in a sample of 1,419 Dutch Holstein-Friesian dairy cows. "Total LPG" (white bar) corresponds to the overall sum of the genus/species-specific LPG.
Figure 2
Figure 2
Frequency distribution of the number of nematode eggs per gram of faeces (EPG) (A), as well as of the breeding value for Log10(EPG+1) (BVLEPG) (B), for 4,048 Holstein-Friesian dairy cows belonging to twelve paternal half-sib pedigrees (EPG: blue; BVLEPG: red)), as well as for the daughters selected for the QTL scan (white: lower tail, black: upper tail). (C) Mean BVLEPG ± 1.96 SE (red circle + error bars), as well as mean (circle) and range (error bars) of the upper (black) and lower (white) tails for each of the twelve daughter group. The number of daughters before selection is shown for each sire.
Figure 3
Figure 3
(A) Information Content of the map used for the initial genome scan (153 autosomal microsatellites) (black), and after increasing the marker density on chromosomes 7, 9, 14 and 19 (red). (B) Location scores (log(1/p)) obtained along the bovine genome in the initial pass for BVLEPG (red) and EPG (blue). The suggestive threshold is shown as a horizontal dotted line. (C) Location scores (log(1/p)) obtained along the bovine genome in the second pass for BVLEPG (red) and EPG (blue). The threshold (p < 0.05) for genome-wide significance is shown as a horizontal dotted line.
Figure 4
Figure 4
Chromosome-wide location scores (log(1/p)) along the chromosome 9 (A) and 19 (B) maps, for BVLEPG (red) and EPG (blue). Marker positions are marked by white triangles. The distribution of most likely QTL position across 1,000 bootstrap samples are marked by gray bars; the resulting 95% confidence interval is shown as a red horizontal line. The insets shows the results of the within family analysis for BVLEPG (red) and EPG (blue). The most likely QTL position (cM) is given above the bar graphs for families exceeding chromosome-wide significance.
Figure 5
Figure 5
(A) Pairwise LD between BTA19 markers measured as D' (lower left) and as r2 (upper right). Values above 0.3 are highlighted in red, values between 0.2 and 0.3 in light blue, and values < 0.2 in dark blue. (B) Results of the combined linkage plus LD analysis for LEPG. The triangles mark the map position (cM) of microsatellites and SNPs added for fine-mapping. The location score profile in blue correspond to the linkage signal, in red to the linkage plus the LD signal from the paternal chromosomes, and in green to the linkage plus de complete LD signal. The Y-axis corresponds to lod scores.

References

    1. Gross SJ, Ryan WG, Ploeger HW. Anthelmintic treatment of dairy cows and its effect on milk production. Vet Rec. 1999;144:581–587. - PubMed
    1. Ketzis JK, Vercruysse J, Stromberg BE, Larsen M, Athanasiadou S, Houdijk JG. Evaluation of efficacy expectations for novel and non-chemical helminth control strategies in ruminants. Vet Parasitol. 2006;139:321–35. doi: 10.1016/j.vetpar.2006.04.022. - DOI - PubMed
    1. Stear MJ, Doligalska M, Donskow-Schmelter K. Alternatives to anthelmintics for the control of nematodes in livestock. Parasitology. 2007;134:139–151. doi: 10.1017/S0031182006001557. - DOI - PubMed
    1. Bisset SA, Morris CA, McEwan JC, Vlassoff A. Breeding sheep in New Zealand that are less reliant on anthelmintics to maintain health and productivity. N Z Vet J. 2001;49:236–246. - PubMed
    1. Windon RG. Selective breeding for the control of nematodiasis in sheep. Rev Sci Tech. 1990;9:555–576. - PubMed

Publication types

MeSH terms