. 2009 Mar 4;96(5):1675-90.
doi: 10.1016/j.bpj.2008.09.061.

A mesoscale model of DNA and its renaturation

Affiliations

A mesoscale model of DNA and its renaturation

E J Sambriski et al. Biophys J. .

Abstract

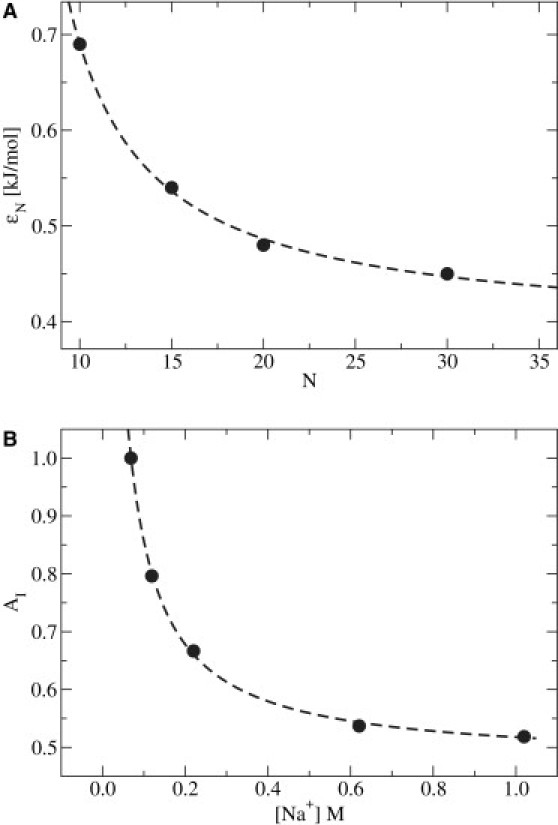
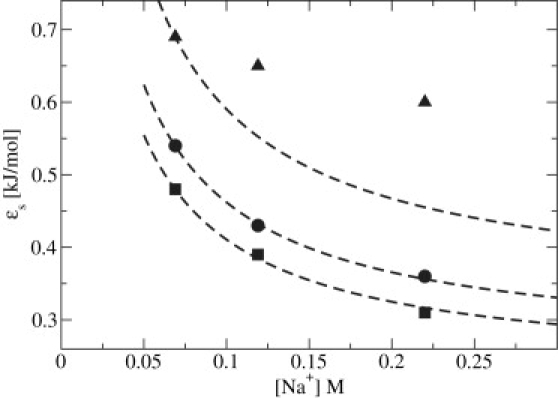
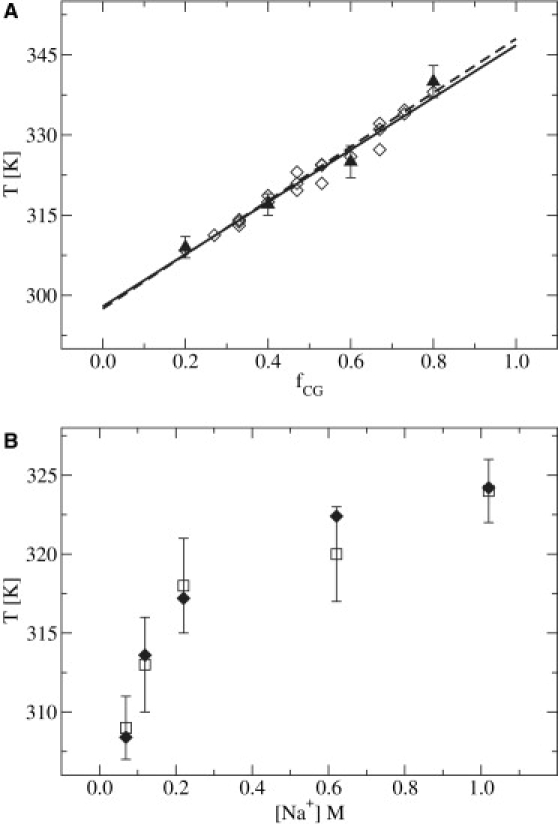
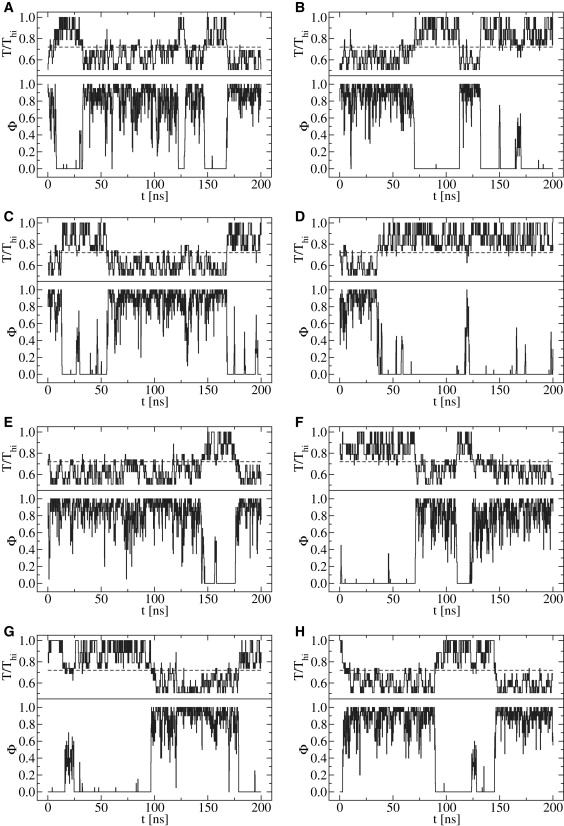
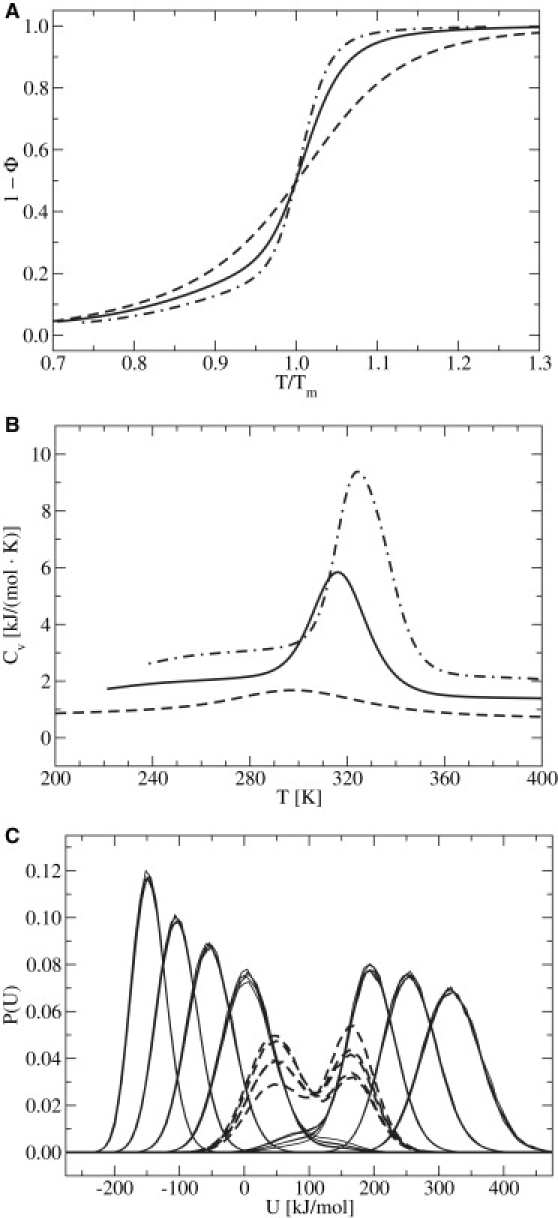
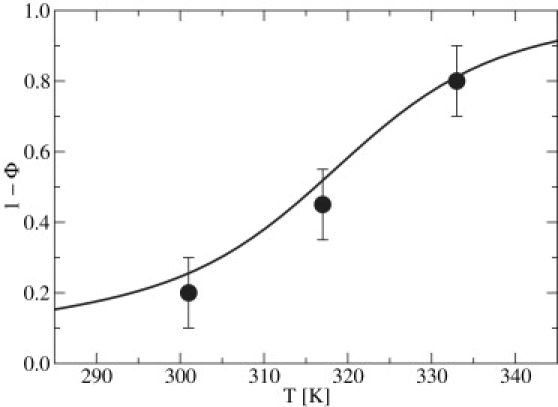
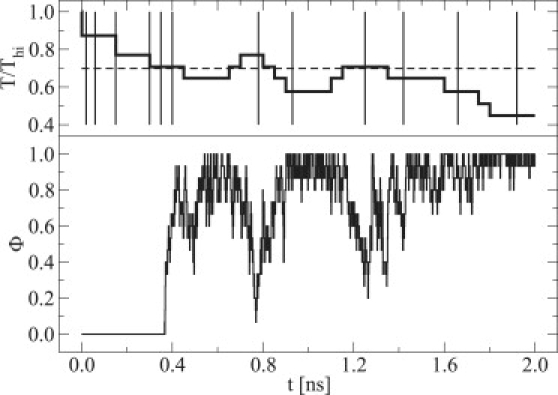
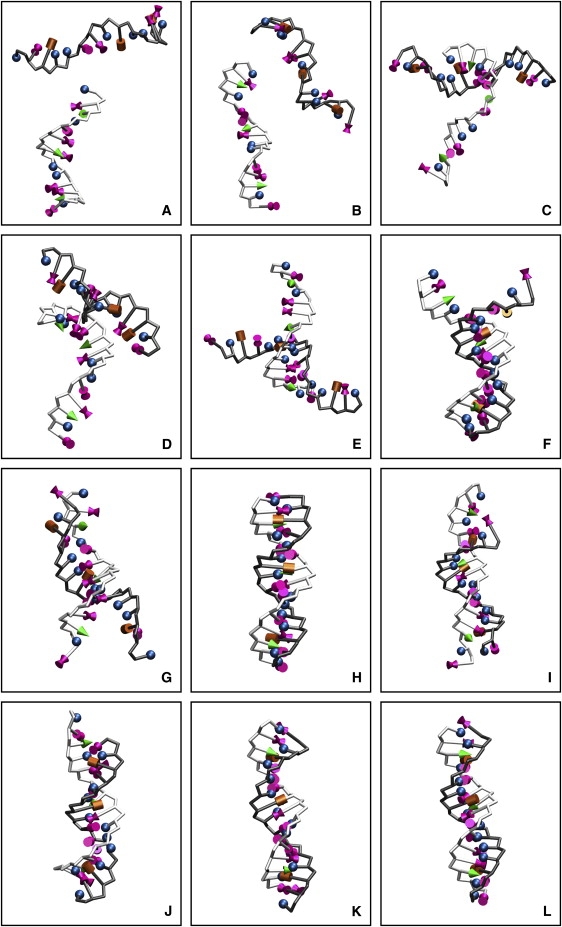
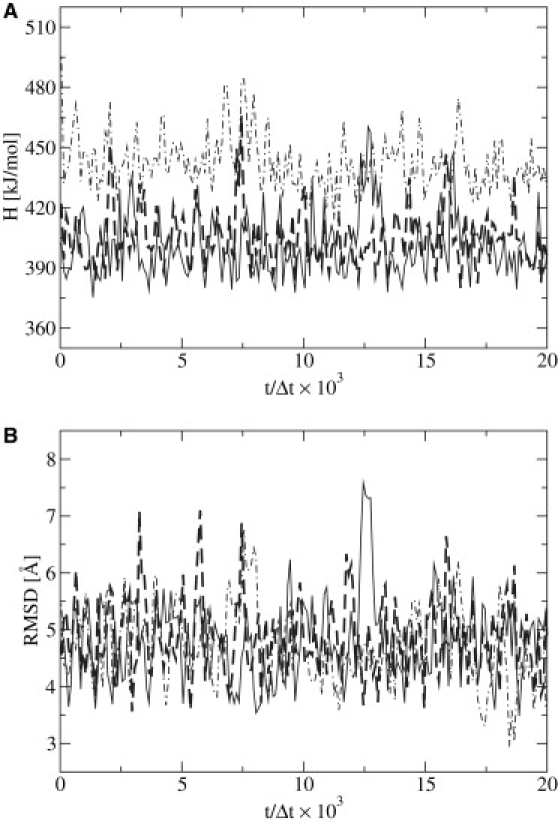
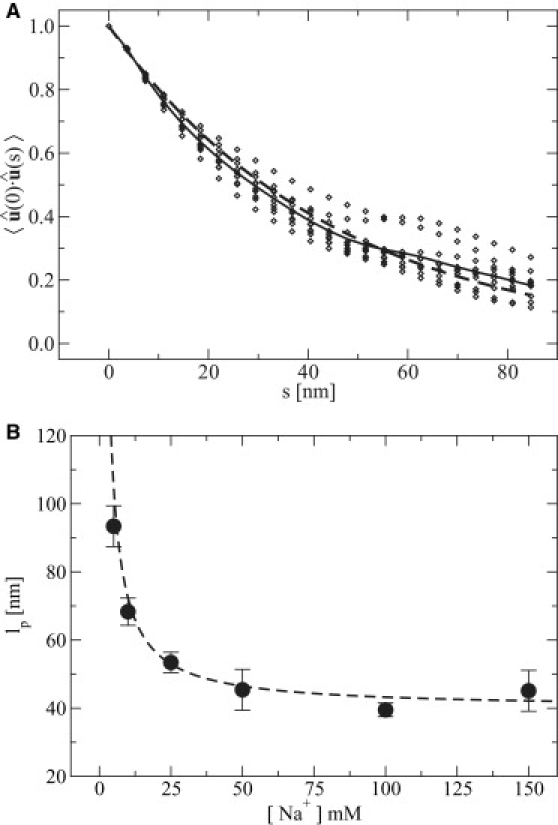
A mesoscale model of DNA is presented (3SPN.1), extending the scheme previously developed by our group. Each nucleotide is mapped onto three interaction sites. Solvent is accounted for implicitly through a medium-effective dielectric constant and electrostatic interactions are treated at the level of Debye-Hückel theory. The force field includes a weak, solvent-induced attraction, which helps mediate the renaturation of DNA. Model parameterization is accomplished through replica exchange molecular dynamics simulations of short oligonucleotide sequences over a range of composition and chain length. The model describes the melting temperature of DNA as a function of composition as well as ionic strength, and is consistent with heat capacity profiles from experiments. The dependence of persistence length on ionic strength is also captured by the force field. The proposed model is used to examine the renaturation of DNA. It is found that a typical renaturation event occurs through a nucleation step, whereby an interplay between repulsive electrostatic interactions and colloidal-like attractions allows the system to undergo a series of rearrangements before complete molecular reassociation occurs.


Figures

Figure 1
Figure 1
Energy strength of the solvent-induced interaction. (A) Dependence on chain length in [Na+] = 0.069 M. (B) Dependence on ionic strength for Nnt = 15. Results from exploratory simulations (circles) and corresponding nonlinear regressions (dashed lines) are also shown. For long chains (Nnt ≳ 30) and high ionic strength ([Na+] ≳ 1 M), both contributions saturate to a limiting value.
Figure 2
Figure 2
Study on combining the effects of chain length and ionic activity on the solvent-induced interaction. Data are presented for Nnt ∈ (10, triangles; 15, circles; and 20, squares). To obtain energy scale profiles for other systems, the reference system (Nnt = 15) AI is rescaled with respect to the energy strength ɛN of the corresponding chain length in [Na+] = 0.069 M (dashed lines). With the exception of the shortest chain studied, the approximation ɛsɛNAI holds, with ɛN being a numerical prefactor and AI serving as a universal curve.
Figure 3
Figure 3
Comparison of REMD results with experimental data. (A) Tm as a function of chain composition for Nnt = 15 in [Na+] = 0.069 M for the systems studied in Table 2 (triangles, dotted line) and data from Owczarzy et al. (52) (diamonds, solid line), where lines are the corresponding linear regressions. (B) Tm as a function of [Na+] for Nnt = 15 and fCG = 0.2.
Figure 4
Figure 4
Representative molecular trajectories in T-space obtained from REMD simulation. The eight replicas used in the realization are shown for Nnt = 20 in [Na+] = 0.220 M. In each panel, the upper portion is T normalized by the highest replica temperature, Thi. For reference, Tm is also shown (dashed line). The lower portion of each panel shows the corresponding value of Φ.
Figure 5
Figure 5
DNA denaturation becomes cooperative with increasing chain length, as evidenced by a sharper response in the transition. (A) (1 − Φ) as a function of T normalized with respect to Tm. (B) Cv as a function of T. Data are for Nnt ∈ (10, dashed line; 20, solid line; and 30, dot-dashed line), for fCG = 0.2 in [Na+] = 0.069 M. (C) Probability distributions of energy from five of ten realizations for the Nnt = 20 system. (From left to right, T = 220, 247, 272, 298, 316, 338, 378, and 408 K.) At Tm = 316 K, the system exhibits an evident bimodal probability distribution (dashed curves).
Figure 6
Figure 6
Assessing data from the melting curve obtained by REMD. The Nnt = 15 system with fCG = 0.4 in [Na+] = 0.069 M was used as a representative case. Shown are data from >100 independent realizations using LD (circles) with corresponding error bars, and data from REMD treated with WHAM (line).
Figure 7
Figure 7
Time series data for a renaturation event in DNA. The Nnt = 15 system with fCG = 0.2 in [Na+] = 0.119 M was used as a representative case. Shown in the upper portion of the panel are selected instances (vertical lines) of T (thick line) for the analysis of the renaturation event; for reference, Tm is also shown (dashed line). The corresponding value of Φ in the time series is shown in the lower portion of the panel.
Figure 8
Figure 8
Configurations for the instances specified in Fig. 7. The backbone of each strand has been shaded differently and nucleic base moieties have been depicted as shapes as a guide to the eye. The sense strand (lighter chain) is shown with its complement (darker chain), with the nucleic bases adenine (bowtie), thymine (sphere), cytosine (cone), and guanine (cylinder). The instances selected in T-space from Fig. 7 are referenced from left to right as AL. Initially, ssDNA molecules are found at a significant separation (A and B). As the system samples lower T, the formation of dsDNA is favored. The process first emerges with chains approaching closely (C and D), until a nucleation event sets in panels EG, such that strands can associate to yield dsDNA (H). When the system transiently samples higher T, dsDNA is destabilized (I and J). As the system returns to lower T, dsDNA emerges again (K and L).
Figure 9
Figure 9
Stability of the LD integrator. (A) Hamiltonian (H) of the system. (B) Root mean-square deviation (RMSD) of configurations. Data are presented as a function of time t normalized by the simulation time step Δt ∈ (5 fs, solid line; 10 fs, heavy dashed line; and 30 fs, dot-dashed line).
Figure 10
Figure 10
Persistence length calculations. (A) Plot of the orientational correlation function as a function of chain position, s, for Nnt = 250 dsDNA in [Na+] = 0.150 M. Data are shown for 10 independent realizations (diamonds), the average of the realizations (solid line), and the nonlinear regression of Eq. 25 (dashed line). (B) Effect of ionic strength on persistence length for Nnt = 250. Simulation data (circles) were fit according to Eq. 26, with lp0 = 40 nm (dashed line).

Similar articles

Cited by

References

    1. Kornyshev A.A., Leiken S. Electrostatic interaction between helical macromolecules in aggregates: an impetus for DNA poly- and mesomorphism. Proc. Natl. Acad. Sci. USA. 1998;95:13579–13584. - PMC - PubMed
    1. Solis F.J., Olvera de la Cruz M. Attractive interactions between rodlike polyelectrolytes: polarization, crystallization, and packing. Phys. Rev. E Stat. Phys. Plasmas Fluids Relat. Interdiscip. Topics. 1999;60:4496–4499. - PubMed
    1. Lyubartsev A.P., Nordenskiöld L. Monte Carlo simulation study of DNA polyelectrolyte properties in the presence of multivalent polyamine ions. J. Phys. Chem. B. 1997;101:4335–4342.
    1. Gil Montoro J.C., Abascal J.L.F. Ionic distribution around simple DNA models. I. Cylindrically averaged properties. J. Chem. Phys. 1995;103:8273–8284.
    1. Schlick T., Olson W.K. Supercoiled DNA energetics and dynamics by computer simulation. J. Mol. Biol. 1992;223:1089–1119. - PubMed

Publication types

LinkOut - more resources