. 2009 Mar 4;96(5):1944-51.
doi: 10.1016/j.bpj.2008.10.070.

Chromatin stability at low concentration depends on histone octamer saturation levels

Affiliations

Chromatin stability at low concentration depends on histone octamer saturation levels

Thomas A Hagerman et al. Biophys J. .

Abstract

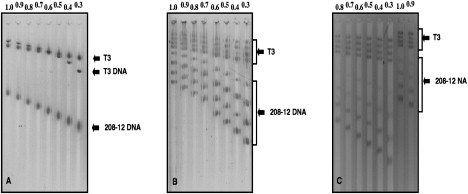
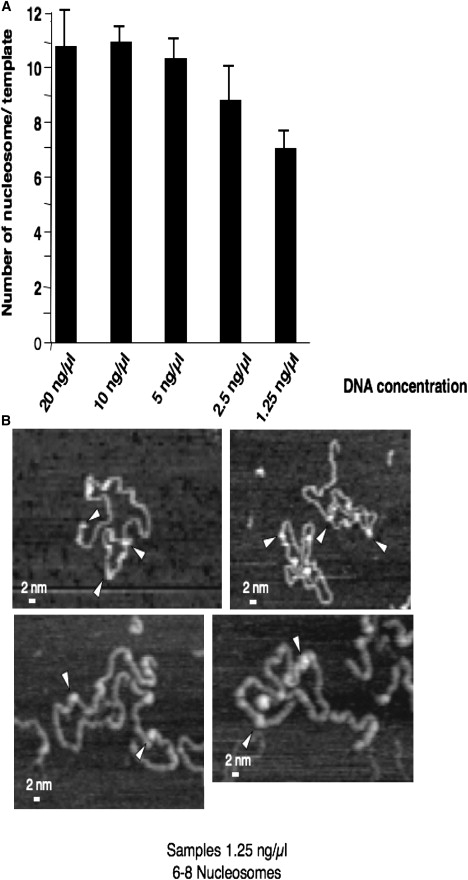
Studies on the stability of nucleosome core particles as a function of concentration have indicated a lower limit of approximately 5 ng/microL, below which the complexes start to spontaneously destabilize. Until recently little information was available on the effect of low concentration on chromatin. Using the well-characterized array of tandemly repeated 5S rDNA reconstituted into chromatin, we have investigated the effect of dilution. In this study, we demonstrate that the stability of saturated nucleosomal arrays and that of nucleosome core particles are within the same order of magnitude, and no significant loss of histones is monitored down to a concentration of 2.5 ng/microL. We observed that levels of subsaturation of the nucleosomal arrays were directly correlated with an increased sensitivity to histone loss, suggesting a shielding effect. The loss of histones from our linear nucleosomal arrays was shown not to be random, with a significant likelihood to occur at the end of the template than toward the center. This observation indicates that centrally located nucleosomes are more stable than those close to the end of the DNA templates. Itis important to take this information into account for the proper design of experiments pertaining to histone composition and the folding ability of chromatin samples.


Figures

Figure 1
Figure 1
Multigel analysis after single and multiple loading. (A) Single loading of 208-12 DNA. The DNA (20 ng/μL) and T3 phage, used as internal marker, were electrophoresed using a standard eight-lane gel. The percentages of agarose are indicated above the lanes. The T3 phage can partially dissociate, liberating its genomic DNA (indicated as T3 DNA). Migration distances were measured and used to determine the Pe, Re, and μ0. (B) Multiple-loading of multigel. A similar gel setup was used to analyze 208-12 DNA, at a concentration of 20 ng/μL, sequentially loaded with T3 phage at 1-h intervals. (C) Multiple-loading of multigel. 208-12 NA was electrophoresed at concentrations ranging from 20 to 2.5 ng/μL after sequential loading with internal control T3 phage at 1-h intervals. Note: the loading order was different from that of A and B. Migration distances were recorded and used as described above. All gels were stained with SYBR green.
Figure 2
Figure 2
AFM images of saturated NA at 20 ng/μL. Reconstituted NAs were deposited on 3-aminopropyltriethoxysilane-treated mica slides and imaged by AFM. Individual nucleosomes are indicated by white arrowheads. The nucleosomes were counted on each individual NA. The average number of nucleosomes was determined to be 10–11 per NA template.
Figure 3
Figure 3
QAGE analysis of saturated NA stability as a function of concentration. (A) SYBR green staining of the multigel revealed the location of the internal marker T3 phage. The migration distances were used to determine the Pe of the various gels. The agarose percentages are indicated above the lanes. (B) Multiple loading of saturated NAs at concentrations ranging from 20 to 1.25 ng/μL. After electrophoresis, the DNA was transferred to a membrane and probed by Southern hybridization (using probes recognizing the T3 phage DNA and the 208 DNA sequence). Distances of migration of the sequentially loaded samples were used to calculate the Re and μ0.
Figure 4
Figure 4
Stability of saturated NAs as a function of concentration. (A) The number of nucleosomes present on the NA at various concentrations was derived from the multigel analysis. The DNA concentrations are indicated on the x axis. The number of nucleosomes per NA is indicated on the y axis. (B) AFM images of saturated NA at 1.25 ng/μL. The average number of nucleosomes per DNA template was estimated to be between six and eight per individual NA.
Figure 5
Figure 5
Stability of subsaturated NAs as a function of concentration. As for saturated NAs, chromatin samples assembled at ratios R = 0.8 (black bars), R = 0.6 (gray bars), and R = 0.4 (white bars) were sequentially diluted and electrophoresed in multigels. DNA concentrations are indicated on the x axis. The number of nucleosomes per NA is indicated on the y axis.
Figure 6
Figure 6
Histone composition of NAs at high and low concentrations. Coomassie staining enhanced with silver of NAs at concentrations ranging from 20 ng/μL to 0.625 ng/μL recovered after MgCl2 precipitation. The location of the core histones is indicated on the left side. Note that histones H2A and H2B tend to comigrate. The black arrowheads indicate the position of the molecular weight markers.

Similar articles

Cited by

References

    1. Schneider R., Grosschedl R. Dynamics and interplay of nuclear architecture, genome organization, and gene expression. Genes Dev. 2007;21:3027–3043. - PubMed
    1. Georgel P.T. Chromatin structure of eukaryotic promoters: a changing perspective. Biochem. Cell Biol. 2002;80:295–300. - PubMed
    1. Hansen J.C. Conformational dynamics of the chromatin fiber in solution: determinants, mechanisms, and functions. Annu. Rev. Biophys. Biomol, Struct. 2002;31:361–392. - PubMed
    1. Woodcock C.L., Dimitrov S. Higher-order structure of chromatin and chromosomes. Curr. Opin. Genet. Dev. 2001;11:130–135. - PubMed
    1. Choudhary P., Varga-Weisz P. ATP-dependent chromatin remodelling: action and reaction. Subcell. Biochem. 2007;41:29–43. - PubMed

Publication types

LinkOut - more resources