

Probing membrane order and topography in supported lipid bilayers by combined polarized total internal reflection fluorescence-atomic force microscopy
- PMID: 19254557
- PMCID: PMC2717349
- DOI: 10.1016/j.bpj.2008.11.041
Probing membrane order and topography in supported lipid bilayers by combined polarized total internal reflection fluorescence-atomic force microscopy
Abstract
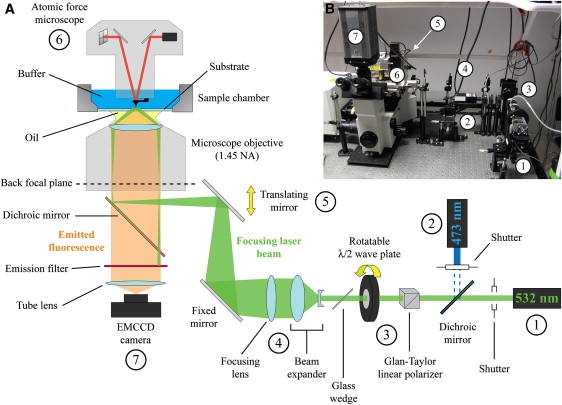
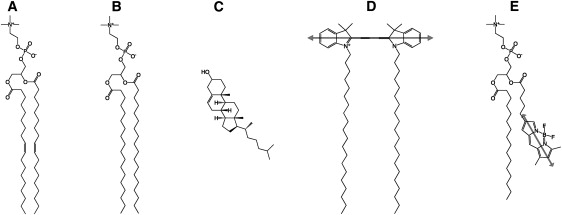
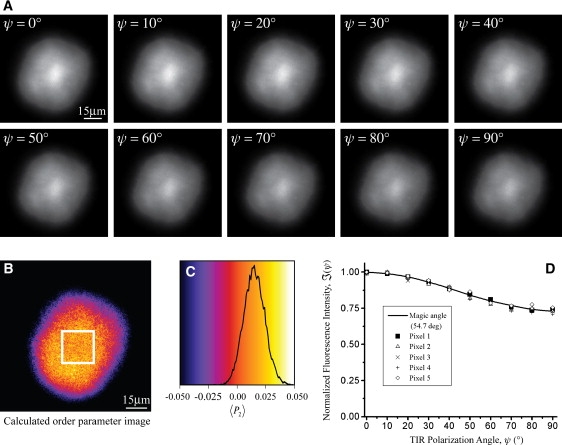
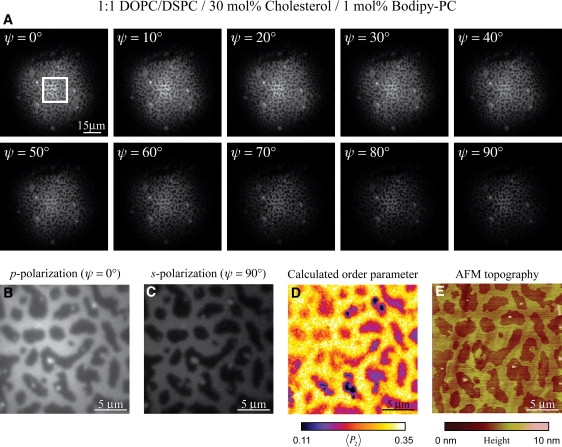
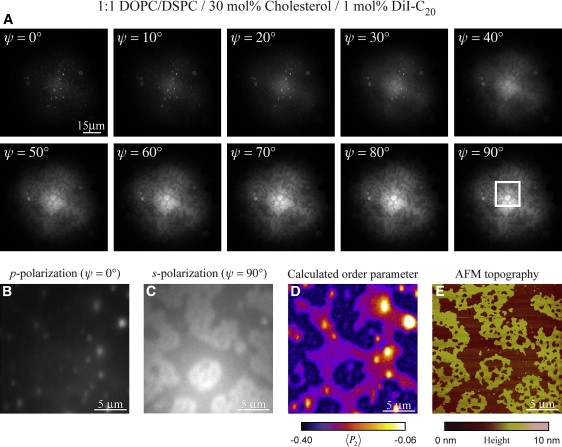
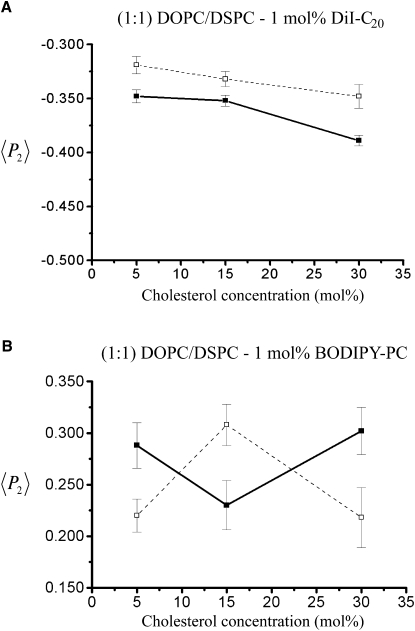
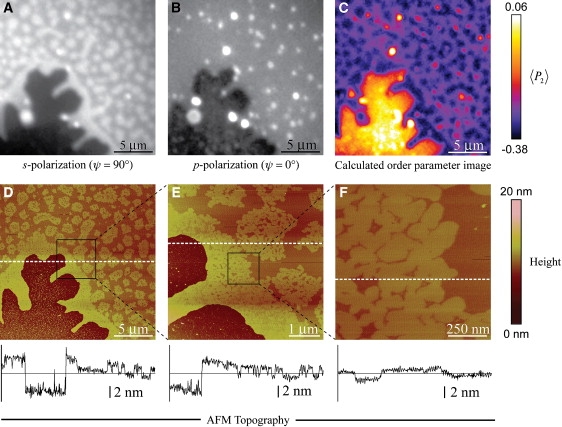
Determining the local structure, dynamics, and conformational requirements for protein-protein and protein-lipid interactions in membranes is critical to understanding biological processes ranging from signaling to the translocating and membranolytic action of antimicrobial peptides. We report here the application of a combined polarized total internal reflection fluorescence microscopy-in situ atomic force microscopy platform. This platform's ability to image membrane orientational order was demonstrated on DOPC/DSPC/cholesterol model membranes containing the fluorescent membrane probe, DiI-C(20) or BODIPY-PC. Spatially resolved order parameters and fluorophore tilt angles extracted from the polarized total internal reflection fluorescence microscopy images were in good agreement with the topographical details resolved by in situ atomic force microscopy, portending use of this technique for high-resolution characterization of membrane domain structures and peptide-membrane interactions.
Figures
Similar articles
-
Peptide-induced domain formation in supported lipid bilayers: direct evidence by combined atomic force and polarized total internal reflection fluorescence microscopy.Biophys J. 2010 Mar 3;98(5):815-23. doi: 10.1016/j.bpj.2009.12.4327. Biophys J. 2010. PMID: 20197035 Free PMC article.
-
Combinatorial microscopy for the study of protein-membrane interactions in supported lipid bilayers: Order parameter measurements by combined polarized TIRFM/AFM.J Struct Biol. 2009 Oct;168(1):21-36. doi: 10.1016/j.jsb.2009.02.011. Epub 2009 Mar 5. J Struct Biol. 2009. PMID: 19268707
-
Correlated fluorescence-atomic force microscopy of membrane domains: structure of fluorescence probes determines lipid localization.Biophys J. 2006 Mar 15;90(6):2170-8. doi: 10.1529/biophysj.105.073510. Epub 2005 Dec 16. Biophys J. 2006. PMID: 16361347 Free PMC article.
-
Combined scanning probe and total internal reflection fluorescence microscopy.Methods. 2008 Sep;46(1):2-10. doi: 10.1016/j.ymeth.2008.05.011. Epub 2008 Jul 2. Methods. 2008. PMID: 18602010 Review.
-
AFM as a high-resolution imaging tool and a molecular bond force probe.Cell Biochem Biophys. 2004;41(3):435-50. doi: 10.1385/CBB:41:3:435. Cell Biochem Biophys. 2004. PMID: 15509891 Review.
Cited by
-
Imaging Membrane Curvature inside a FcεRI-Centric Synapse in RBL-2H3 Cells Using TIRF Microscopy with Polarized Excitation.J Imaging. 2019 Jul;5(7):63. doi: 10.3390/jimaging5070063. Epub 2019 Jul 4. J Imaging. 2019. PMID: 31360699 Free PMC article.
-
Peptide-induced domain formation in supported lipid bilayers: direct evidence by combined atomic force and polarized total internal reflection fluorescence microscopy.Biophys J. 2010 Mar 3;98(5):815-23. doi: 10.1016/j.bpj.2009.12.4327. Biophys J. 2010. PMID: 20197035 Free PMC article.
-
The mechanism of membrane disruption by cytotoxic amyloid oligomers formed by prion protein(106-126) is dependent on bilayer composition.J Biol Chem. 2014 Apr 11;289(15):10419-10430. doi: 10.1074/jbc.M113.515866. Epub 2014 Feb 19. J Biol Chem. 2014. PMID: 24554723 Free PMC article.
-
Biophysical approaches for exploring lipopeptide-lipid interactions.Biochimie. 2020 Mar;170:173-202. doi: 10.1016/j.biochi.2020.01.009. Epub 2020 Jan 21. Biochimie. 2020. PMID: 31978418 Free PMC article. Review.
-
Progress in the Correlative Atomic Force Microscopy and Optical Microscopy.Sensors (Basel). 2017 Apr 24;17(4):938. doi: 10.3390/s17040938. Sensors (Basel). 2017. PMID: 28441775 Free PMC article. Review.
References
-
- Pike L.J. Rafts defined: a report on the Keystone Symposium on lipid rafts and cell function. J. Lipid Res. 2006;47:1597–1598. - PubMed
-
- Shimshic E.J., McConnell H.M. Lateral phase separation in phospholipid membranes. Biochemistry. 1973;12:2351–2360. - PubMed
-
- Simons K., Ikonen E. Functional rafts in cell membranes. Nature. 1997;387:569–572. - PubMed
-
- Brown D.A., London E. Functions of lipid rafts in biological membranes. Annu. Rev. Cell Dev. Biol. 1998;14:111–136. - PubMed
-
- Edidin M. The state of lipid rafts: from model membranes to cells. Annu. Rev. Biophys. Biomol. Struct. 2003;32:257–283. - PubMed
Publication types
MeSH terms
Substances
LinkOut - more resources
Full Text Sources
