. 2009 Mar;9(3):265-76.
doi: 10.1016/j.cmet.2009.01.012.

Cyclic AMP produced inside mitochondria regulates oxidative phosphorylation

Affiliations

Cyclic AMP produced inside mitochondria regulates oxidative phosphorylation

Rebeca Acin-Perez et al. Cell Metab. 2009 Mar.

Abstract

Mitochondria constantly respond to changes in substrate availability and energy utilization to maintain cellular ATP supplies, and at the same time control reactive oxygen radical (ROS) production. Reversible phosphorylation of mitochondrial proteins has been proposed to play a fundamental role in metabolic homeostasis, but very little is known about the signaling pathways involved. We show here that protein kinase A (PKA) regulates ATP production by phosphorylation of mitochondrial proteins, including subunits of cytochrome c oxidase. The cyclic AMP (cAMP), which activates mitochondrial PKA, does not originate from cytoplasmic sources but is generated within mitochondria by the carbon dioxide/bicarbonate-regulated soluble adenylyl cyclase (sAC) in response to metabolically generated carbon dioxide. We demonstrate for the first time the existence of a CO(2)-HCO(3)(-)-sAC-cAMP-PKA (mito-sAC) signaling cascade wholly contained within mitochondria, which serves as a metabolic sensor modulating ATP generation and ROS production in response to nutrient availability.


Figures
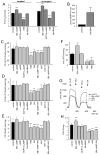
Fig 1
Fig 1. Regulation of OXPHOS by cAMP-PKA agonists and antagonists
A) Respiration (coupled and uncoupled) in HeLa cells after 8Br-cAMP (n=6), 8CPT methyl-cAMP (8CPTm-cAMP) (n=3), H89 (n=6), for 0.5 hours or with forskolin plus IBMX (fsk-IBMX) (n=3). Control, untreated cells (n=33). Values are fmoles O2 per min per cell. B) Cellular cAMP levels after stimulation of tmAC with fsk-IBMX. Values are pmol cAMP per 106 cells. C-E) OXPHOS in mouse liver mitochondria. State III (phosphorylating) mitochondrial respiration driven by glutamate/malate (C); succinate (D) or TMPD/ascorbate (E). Compounded number of replicas were: control (n=21); 8Br-cAMP (n=9); cAMP (n=3); 8CPTm-cAMP (n=3); forskolin+IMBX (fsk+IBMX, n=3); H89 (n=9); PKI 14-22 (1μM n=3); 8Br-cAMP+PKI (n=3); KH7 (n=9); KH7.15 (n=3) and 8Br-cAMP+KH7 (n=3). F) ATP synthesis with 8Br-cAMP (n=3), cAMP (n=3), H89 (n=3), PKI 14-22 (PKI, n=3). Values are nmoles ATP per min per mg of mitochondrial protein. G) Safranin-O fluorescence curves showing changes in mitochondrial membrane potential (ΔΨm) driven by glutamante/malate (G+M) and inhibited by rotenone (Rot), or driven by succinate (Succ) and blocked by the complex III inhibitor antimycin A (AA). Values are relative fluorescent units (RFU). The plots are representative of three independent determinations, which showed similar responses. H) COX Vmax (IU per milligram of protein, n=9). *, p<0.05; **, p<0.001; ***, p<0.0001.
Fig. 2
Fig. 2. sAC is localized and generates cAMP in mitochondria
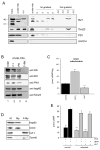
A) Mitochondria isolated from mouse liver after to two rounds of Nycodenz gradient purification. Lanes 2, 3, 4, and 5 were from the first round. Fractions 4.2, 4.3, 4.4 and 4.5 were from a second round of purification of fraction 4. Tim 23, mitochondrial marker. PDI, protein disulfide isomerase, ER rmarker. GAPDH, cytoplasmic marker,. Hom, homogenate B) Expression of sACt-HA in total cell homogenate of transiently transfected COS cells and in crude non-treated (n.t) mitochondrial fractions detected by R21 and HA antibodies. PK, Proteinase K; T+PK (Triton X-100 and PK). Hsp60 and Tim23 are markers of the matrix and the inner membrane, respectively. C) cAMP levels in intact mouse liver mitochondria in the presence of bicarbonate (HCO3) or KH7. Values are pmol cAMP per mg mitochondrial protein (n=3). D) Mitoplasts purity tested using protein markers for the different mitochondrial compartments: Hsp60 (matrix), COXI (inner membrane), cytochrome c (Cyt c, intermembrane space), Tom40 (outer membrane). M (intact mitochondria), Mp (mitoplasts), P-Mp (post-mitoplast fraction). E) Residual cAMP levels after 50pmol cAMP were added to a reaction mixture containing sonicated mitoplasts (mitoplast) or no mitoplasts (control), with and without PDE plus calmodulin (PDE), IBMX, or KH7. n=3 for each reaction. ***, p<0.0001.
Fig. 3
Fig. 3. Transgenic sACt localizes to mitochondria and increases OXPHOS
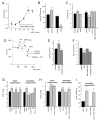
A) Localization of tsAC in untransfected (unstransf) and sACt overexpressing (sACt) cells in homogenates (hom. lane) and pure mitochondria from fraction 4 of the Nycodenz gradient (lane 4). The major 48kDa immunoreactive band corresponds to the molecular size of sACt. A similar size band, faintly detectable in untransfected 293T cells, presumably corresponds to an isoform of endogenous sAC. B) Mitochondrial respiration was increased in cells expressing sACt in comparison to untransfected ones (n=9) in a KH7 sensitive manner (n=3). sACt overexpression stimulated COX specific activity (C, n=9) and ATP synthesis (D, n=9). The increase in both COX and ATP synthesis was KH7 sensitive (n=3 in C and D). ***, p<0.0001.
Fig. 4
Fig. 4. CO2-TCA and sAC modulation regulates OXPHOS
A) COX Vmax in isolated mitochondria treated with increasing concentration of HCO3, from 5mM to 40mM (n=6). B, C) Isolated mitochondria from mouse liver incubated with bicarbonate (HCO3) (n=4), or NaCl (n=3) or KH7, (n=9), KH7.15, (n=3), KH7 plus 8Br-cAMP (n=3). ATP synthesis (B) was increased by HCO3 treatment whereas KH7 inhibited it. COX Vmax was increased by HCO3, whereas KH7 diminished it (C). COX Vmax decrease was not observed with KH7.15, and was rescued by 8Br-cAMP. D) A representative trace of respiration driven by COX using TMPD/ascorbate mouse liver mitochondria. AA is added to mitochondria before TMPD/ascorbate to block electron transfer upstream of COX. KCN is added at the end to inhibit COX. Each addition is marked by downward arrowheads. E) Quantification of the experiments shown in D (n=9). F) KH7 (n=6) reduced respiration in intact HeLa cells and this inhibition was prevented by 8Br-cAMP (n=3), but not by forskolin plus IBMX (n=3). Control, untreated cells (n=33). G) COX activity in intact or sonicated mitochondria with or without the inhibitory anti-sAC antibody R21. HCO3 stimulation of COX was antibody insensitive in intact mitochondria, whereas it was abolished in sonicated mitochondria by R21 (n=3). H) COX activity in intact or sonicated mitochondria with or without PDE. HCO3 stimulation of COX was PDE insensitive in intact mitochondria, whereas it was abolished in sonicated mitochondria by PDE. IBMX prevented the PDE-mediated decrease in COX activity (n=3). I) cAMP levels in sonicated mitochondria were increased by HCO3 and reduced by PDE. IBMX prevented the decrease in cAMP. Values expressed as pmol cAMP per mg mitochondrial protein (n=5). *, p<0.05; **, p<0.001; ***, p<0.0001.
Fig. 5
Fig. 5. Physiological role of the intramitochondrial mito-sAC pathway in the regulation of OXPHOS and ROS production
A) COX Vmax in mouse liver mitochondria with CAI (n=9), CAI plus HCO3 (n=9) and CAI plus 8Br-cAMP (n=9) and pyruvate and malate as substrates. CAI decreased COX activity, which was rescued by HCO3 or 8Br-cAMP. AA (n=6), blocked CO2-production by the TCA cycle and decreased COX activity, which was rescued by HCO3 or 8Br-cAMP. B) cAMP levels in mitochondria decreased when CA or the TCA cycle were blocked with CAI and AA, respectively. HCO3 reverted the effects of CAI or AA (n=8). C) CAI (n=6) decreased respiration in HeLa cells and this inhibition was prevented by 8Br-cAMP (n=3). Control, untreated cells (n=33). D) Respiration in cells grown in glucose or galactose medium (black bars) (n=6) for 48 hours. The calcium ionophore A23187 (dashed bars) increased respiration in control (untreated) cells in glucose. E) ROS production in cells grown in glucose or galactose and treated as in D (n=6). Galactose resulted in decreased ROS production in control cells (black bars). All other comparisons are between treated and untreated cells grown under the same conditions (i.e., glucose or galactose medium). *, p<0.05; **, p<0.001; ***, p<0.0001.
Fig. 6
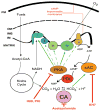
Fig. 6. Diagram of the proposed intramitochondrial CO2-HCO3-sAC-cAMP-PKA regulatory pathway of OXPHOS
Activators and inhibitors of the various steps of the CO2-HCO3-sAC-cAMP-PKA pathway are indicated. Abbreviations: PM, plasma membrane. OM, outer mitochondrial membrane. IMS, inter membrane space. IM, inner mitochondrial membrane. PKA, protein kinase A. sAC, soluble adenylyl cyclase. CA, carbonic anhydrase, KH7, inhibitor of sAC. H89 and PKI (PKI 14-22), inhibitors of PKA. PDE, phosphodiesterase. I through V indicate respiratory chain complexes (I–IV) and Complex V (ATPase).

References

    1. Akerman KE, Wikstrom MK. Safranine as a probe of the mitochondrial membrane potential. FEBS Lett. 1976;68:191–197. - PubMed
    1. Bender E, Kadenbach B. The allosteric ATP-inhibition of cytochrome c oxidase activity is reversibly switched on by cAMP-dependent phosphorylation. FEBS Lett. 2000;466:130–134. - PubMed
    1. Birch-Machin MA, Turnbull DM. Assaying mitochondrial respiratory complex activity in mitochondria isolated from human cells and tissues. Methods Cell Biol. 2001;65:97–117. - PubMed
    1. Bornfeldt KE. A single second messenger: several possible cellular responses depending on distinct subcellular pools. Circ Res. 2006;99:790–792. - PubMed
    1. Bruce JI, Shuttleworth TJ, Giovannucci DR, Yule DI. Phosphorylation of inositol 1,4,5-trisphosphate receptors in parotid acinar cells. A mechanism for the synergistic effects of cAMP on Ca2+ signaling. J Biol Chem. 2002;277:1340–1348. - PubMed

Publication types