. 2009 Mar;9(3):287-302.
doi: 10.1016/j.cmet.2009.01.013.

Pref-1 regulates mesenchymal cell commitment and differentiation through Sox9

Affiliations

Pref-1 regulates mesenchymal cell commitment and differentiation through Sox9

Yuhui Wang et al. Cell Metab. 2009 Mar.

Abstract

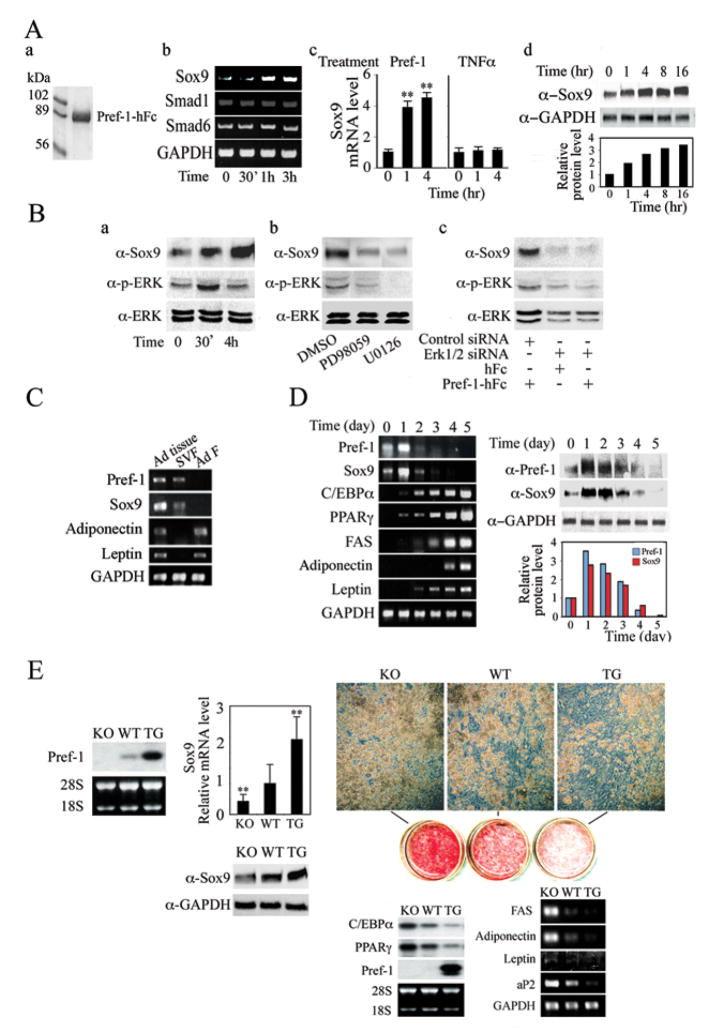
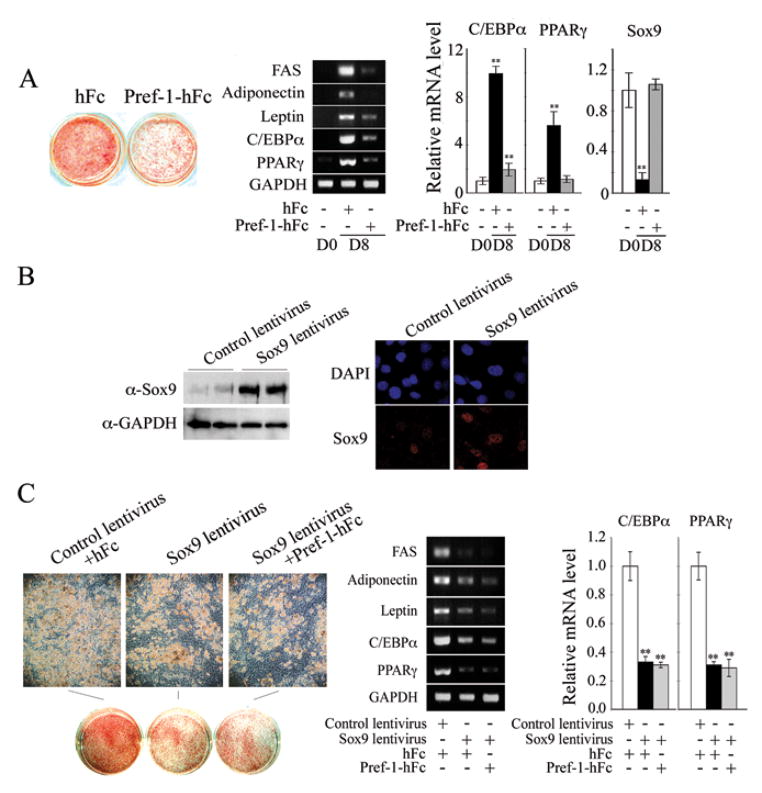
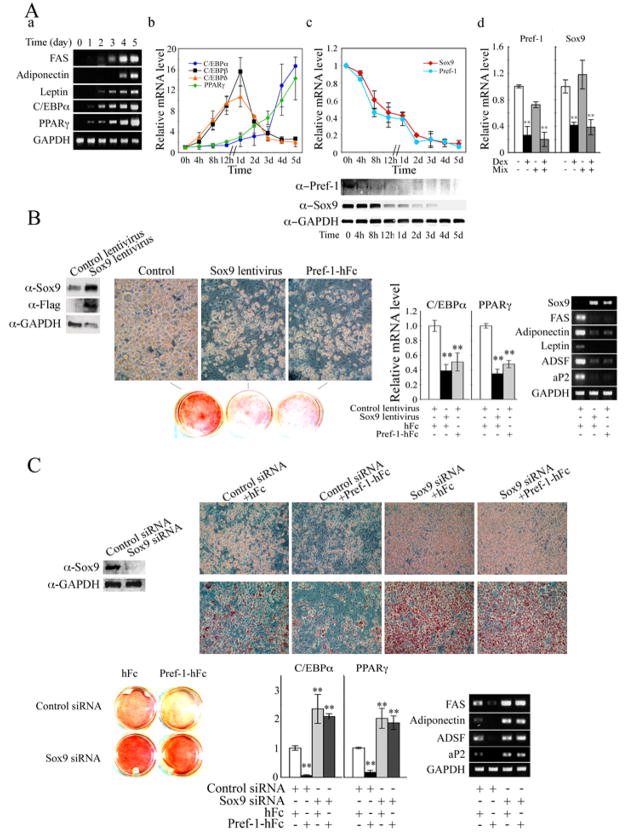
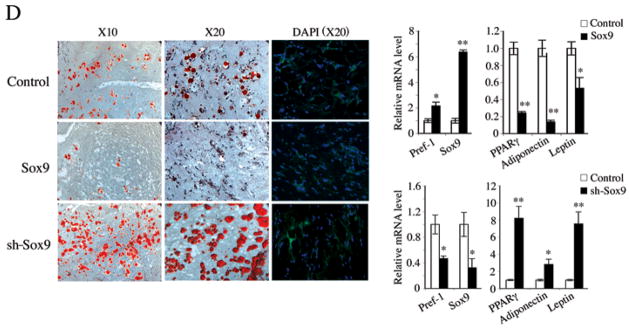
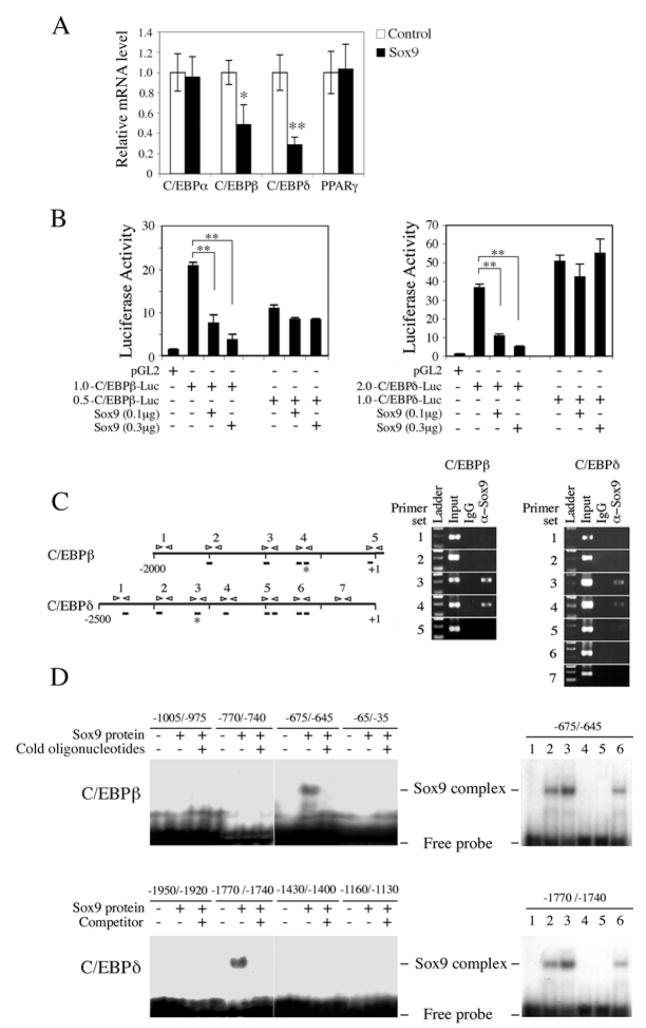
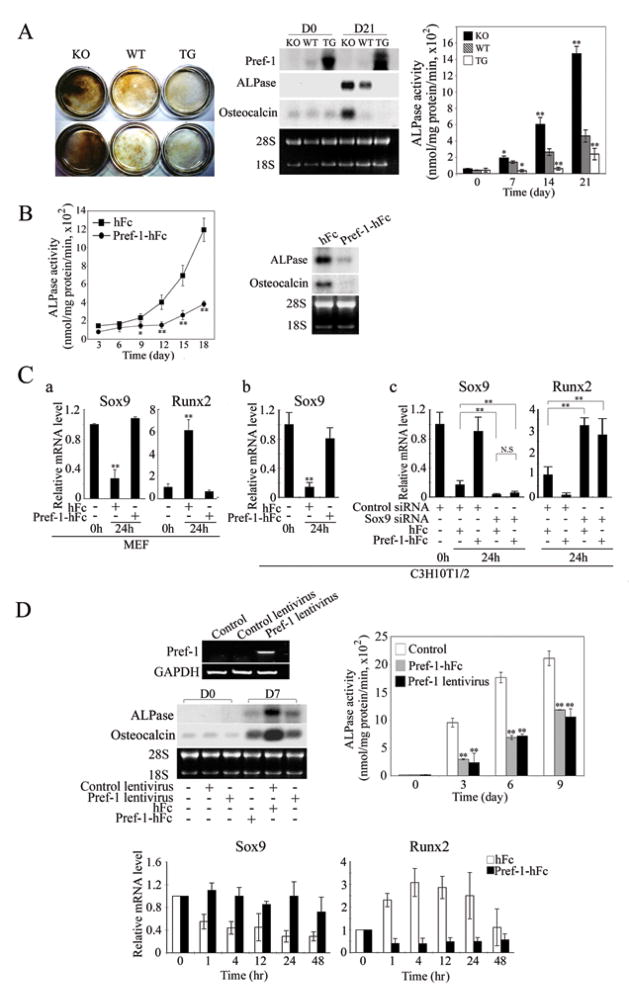
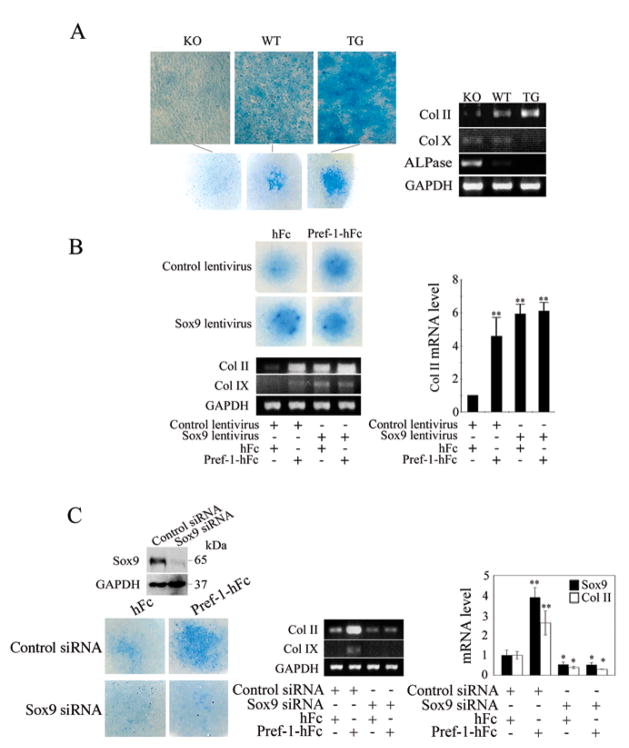
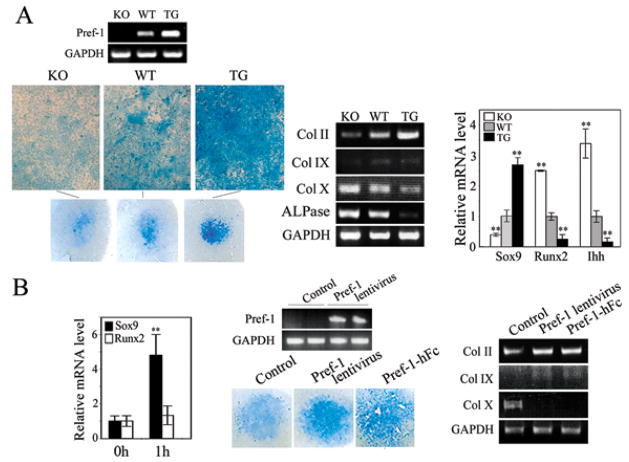
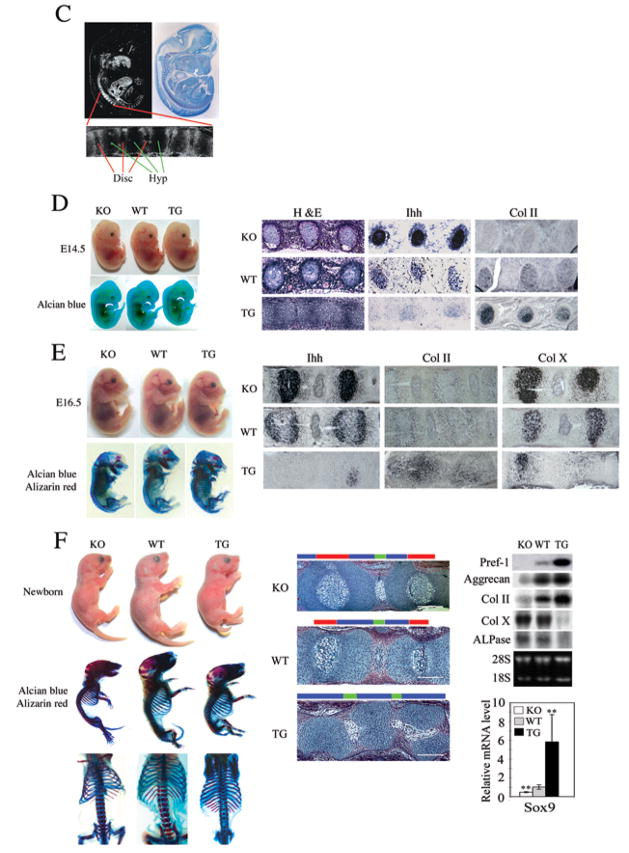
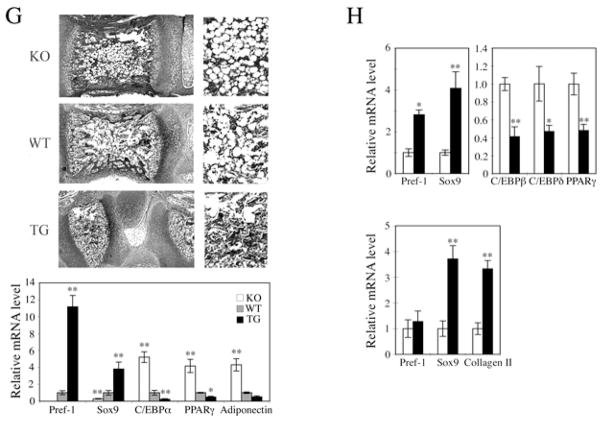
Pref-1 is an EGF repeat-containing transmembrane protein that produces a biologically active soluble form by TACE-mediated cleavage. Although Pref-1 inhibition of adipogenesis has been well established, the specific target(s) of Pref-1 or the Pref-1 function in mesenchymal cell commitment/differentiation are not known. Here, we show that Sox9 downregulation is required for adipocyte differentiation and that Pref-1 inhibits adipocyte differentiation through upregulating Sox9 expression. Sox9 directly binds to the promoter regions of C/EBPbeta and C/EBPdelta to suppress their promoter activity, preventing adipocyte differentiation. Furthermore, we also show that, by inducing Sox9, Pref-1 promotes chondrogenic induction of mesenchymal cells but prevents chondrocyte maturation as well as osteoblast differentiation, with supporting in vivo evidence in Pref-1 null and Pref-1 transgenic mice. Thus, Sox9 is a Pref-1 target, and Pref-1 directs multipotent mesenchymal cells to the chondrogenic lineage but inhibits differentiation into adipocytes as well as osteoblasts and chondrocytes.


Figures

Figure 1
Figure 1
(A) Regulation of Sox9 expression by Pref-1. Coomassie staining of purified Pref-1-hFc (a). RT-PCR (b), RT-qPCR (c) and Western blotting (d) in Pref-1 null MEFs treated with 50 nM Pref-1-hFc or 50 ng/ml TNFα. Results are mean ± SEM; **, P<0.01 compared to that before treatment. (B) Western blotting of cells with Pref-1-hFc treatment (a), ERK1/2 inhibitor (b), and ERK1/2 siRNA transfection (c). (C) RT-PCR for adipose tissue (Ad tissue), stromal vascular fraction (SVF) and adipocyte fraction (Ad F). (D) Pref-1 regulates Sox9 expression during adipocyte differentiation. (E) Comparison of adipocyte differentiation of MEFs from Pref-1 null, wild-type and aP2-Pref-1 transgenic embryos. Northern blot (left panel), RT-qPCR, and Western blot analysis (middle panels) in MEFs at confluence. The value for wild-type MEFs was defined as 1. Results are mean ± SEM; **, P < 0.01 compared to wild-type MEFs. Microscopic morphology, Oil red O staining (right upper panels) and adipogenic transcription factors by Northern blotting and late adipocyte markers by RT-PCR 8 days after induction of adipocyte differentiation (right lower panels).
Figure 2
Figure 2
(A) Pref-1 null MEFs were subjected to adipocyte differentiation in the presence of Pref-1-hFc or control hFc for 8 days. Oil red O staining (left panel), RT-PCR (middle panel) and RT-qPCR (right panel). (B) Expression level of Sox9 was verified by Western blotting (left panel) and by immunofluorescence 48 hrs after infection (right panel). (C) Pref-1 null MEFs overexpressing Sox9 by lentivirus infection were subjected to adipocyte differentiation in the presence of Pref-1-hFc or control hFc. Results are mean ± SEM; **, P < 0.01 compared to differentiated cells infected with control lentivirus or in the presence of hFc.
Figure 3
Figure 3
Pref-1 inhibits 3T3-L1 adipocyte differentiation through Sox9. (A) RT-PCR (a) and RT-qPCR (b and c) for various adipocyte markers during 3T3-L1 adipocyte differentiation. RT-qPCR after 12 h treatment (d). (B) Sox9 protein level after 48 h of infection (left panel). Morphology, Oil red O staining (middle panel), and RT-qPCR and RT-PCR for adipocyte markers (right panels). (C) Sox9 knockdown enhances adipocyte differentiation. Western blotting after 48 h siRNA transfection (left panel). Morphology, Oil red O staining and adipocyte marker expression after adipocyte differentiation. (D) 3T3-F442A-GFP preadipocytes stably overexpressing or with knockdown of Sox9, or control cells (3×10⁷ cells mixed with Matrigel matrix (BD) per site) were injected subcutaneously into the back of SCID mice. The resulting tissues were dissected for Oil red O and DAPI staining and RT-qPCR (n = 4/group).
Figure 3
Figure 3
Pref-1 inhibits 3T3-L1 adipocyte differentiation through Sox9. (A) RT-PCR (a) and RT-qPCR (b and c) for various adipocyte markers during 3T3-L1 adipocyte differentiation. RT-qPCR after 12 h treatment (d). (B) Sox9 protein level after 48 h of infection (left panel). Morphology, Oil red O staining (middle panel), and RT-qPCR and RT-PCR for adipocyte markers (right panels). (C) Sox9 knockdown enhances adipocyte differentiation. Western blotting after 48 h siRNA transfection (left panel). Morphology, Oil red O staining and adipocyte marker expression after adipocyte differentiation. (D) 3T3-F442A-GFP preadipocytes stably overexpressing or with knockdown of Sox9, or control cells (3×10⁷ cells mixed with Matrigel matrix (BD) per site) were injected subcutaneously into the back of SCID mice. The resulting tissues were dissected for Oil red O and DAPI staining and RT-qPCR (n = 4/group).
Figure 4
Figure 4
Sox9 directly binds C/EBPβ and C/EBPδ promoters, and suppresses their transcription. (A) RT-qPCR for various transcription factors 72 h after Sox9 transfection into 3T3-L1 cells. *, P<0.05 and **, P<0.01 compared to cells transfected with empty vector. (B) C/EBPb and C/EBPd promoter activity after co-transfection with Sox9 into 293FT cells. pRL-SV40 was used as internal control. Results are mean ± SEM; **, P<0.01 (C) Numbering denotes primer sets in the C/EBPβ and C/EBPδ promoter regions used for ChIP (left panel). ChIP for C/EBPβ and C/EBPδ using 3T3-L1 cells (right panel). Bar; sites with core consensus Sox9 binding sequence, Star; actual Sox9 binding sites. (D) EMSA for Sox9 binding sites. In vitro translated Sox9 protein and 32P labeled oligonucleotides were used for EMSA. Probe only (lane 1); 1 μl (lane 2) and 2 μl (lane 3) of Sox9 translation reaction with probe; 1 μl of Sox9 with 100 × wild-type competitor (lane 4); 1 μl of translation reaction of empty pcDNA3.1 vector with probe (lane 5); 1 μl of Sox9 with 100 × mutant competitor (lane 6).
Figure 5
Figure 5
Pref-1 inhibits osteoblast differentiation by preventing the decrease in Sox9 expression. (A) Von Kossa staining of MEFs after 21-days of osteoblast differentiation (left panel). Northern blot analysis (middle panel) and ALPase activity (right panel). Results are means ± SEM; *, P<0.05 and **, P<0.01 compared to wild-type cells at indicated time points. (B) ALPase activities (left panel) and Northern blotting after 18-days of osteoblast differentiation (right panel). (C) RT-qPCR for Pref-1 null MEFs and C3H10T1/2 cells cultured for in osteogenic media (a and b). siRNA transfected C3H10T1/2 cells cultured in osteogenic media (c). For Sox9 expression, the value of untreated cells was defined as 1. For Runx2, due to its undetectable level in untreated cells, the value of control siRNA transfected cells after 24 hr treatment was defined as 1. (D) RT-PCR after 48 h lentivirus infection in MC3T3 cells. Northern blot analysis from confluent MC3T3 cells (D0) and 7-days osteogenic treatment (D7), and ALPase activity, **, P<0.01 compared to cells infected with control lentivirus and cultured with hFc at indicated time points. RT-qPCR during osteogenic differentiation (bottom panel).
Figure 6
Figure 6
Pref-1 directs MEF commitment to chondrogenic lineage through Sox9 regulation. (A) Micromass culture of MEFs. Alcian blue staining (left panel) and RT-PCR for chondrogenic markers (right panel) after 14 days of culture. (B) Pref-1 null MEFs infected with Sox9 lentivirus after 10 days micromass culture. **, P<0.01 compared to differentiated cells infected with control empty lentivirus and in the presence of control hFc. (C) Knockdown of Sox9 blocks chondrogenic induction by Pref-1. Alcian blue staining for Pref-1 null MEFs transfected with siRNA after micromass culture. Western blotting after 48 h transfection (left top panel). Results are mean ± SEM; *, P<0.05 and **, P<0.01 compared to cells transfected with control siRNA and treated with hFc.
Figure 7
Figure 7
Pref-1 promotes chondrogenic induction but inhibits chondrocyte maturation through upregulation of Sox9. (A) Micromass culture of cells from newborn tails. Alcian blue staining and RT-PCR and RT-qPCR for chondrogenic markers. **, P<0.01 compared to wild-type. (B) RT-qPCR after 1 hr treatment with 50 nM Pref-1-hFc (left panel), **, P<0.01 compared to untreated cells. RT-PCR in cells 48 hrs after infection. (C) In situ hybridization of E13.5 embryos with 33P labeled Pref-1 anti-sense probe (left panel) and bright field view with hematoxylin staining (left panel). Thoracic-abdominal vertebra region is enlarged (bottom). Disc, spinal disc; Hyp, hypertrophic zone. Embryos and mice, and their skeleton staining (alcian blue for cartilage and alizarin red for bone) in various developmental stages (D–F). Thoracic-abdominal vertebra was used for in situ hybridization with digoxigenin labeled anti-sense probe. H&E staining of 4–5th coccyges from newborn mice (F, middle panel). Color bars represent the length of different histological area. Red bar, zones of hypertrophic chondrocytes; blue bar, the area of resting and proliferating chondrocytes and prehypertrophic chondrocytes; green bar, spinal disc. White bar = 200 μm. Northern blotting and RT-qRCR for skinned tails of newborn mice. **, P<0.01 compare to wild-type. (G and H) Role of Pref-1 in MSC commitment and differentiation. (G) H&E staining (upper panel) of 5th coccyges of 1 wk-old mice and higher magnitude of bone marrow region (right). RT-qPCR for femur bone marrow from 12 week-old mice (n = 5) (lower panel). Results are mean ± SEM; **, P<0.01 compare to wild-type. (H) RT-qPCR of human primary MSC after 2 days adipogenic (upper panel) or chondrogenic treatment (lower panel). *, P<0.05 and **, P<0.01.
Figure 7
Figure 7
Pref-1 promotes chondrogenic induction but inhibits chondrocyte maturation through upregulation of Sox9. (A) Micromass culture of cells from newborn tails. Alcian blue staining and RT-PCR and RT-qPCR for chondrogenic markers. **, P<0.01 compared to wild-type. (B) RT-qPCR after 1 hr treatment with 50 nM Pref-1-hFc (left panel), **, P<0.01 compared to untreated cells. RT-PCR in cells 48 hrs after infection. (C) In situ hybridization of E13.5 embryos with 33P labeled Pref-1 anti-sense probe (left panel) and bright field view with hematoxylin staining (left panel). Thoracic-abdominal vertebra region is enlarged (bottom). Disc, spinal disc; Hyp, hypertrophic zone. Embryos and mice, and their skeleton staining (alcian blue for cartilage and alizarin red for bone) in various developmental stages (D–F). Thoracic-abdominal vertebra was used for in situ hybridization with digoxigenin labeled anti-sense probe. H&E staining of 4–5th coccyges from newborn mice (F, middle panel). Color bars represent the length of different histological area. Red bar, zones of hypertrophic chondrocytes; blue bar, the area of resting and proliferating chondrocytes and prehypertrophic chondrocytes; green bar, spinal disc. White bar = 200 μm. Northern blotting and RT-qRCR for skinned tails of newborn mice. **, P<0.01 compare to wild-type. (G and H) Role of Pref-1 in MSC commitment and differentiation. (G) H&E staining (upper panel) of 5th coccyges of 1 wk-old mice and higher magnitude of bone marrow region (right). RT-qPCR for femur bone marrow from 12 week-old mice (n = 5) (lower panel). Results are mean ± SEM; **, P<0.01 compare to wild-type. (H) RT-qPCR of human primary MSC after 2 days adipogenic (upper panel) or chondrogenic treatment (lower panel). *, P<0.05 and **, P<0.01.

References

    1. Abdallah BM, Jensen CH, Gutierrez G, Leslie RG, Jensen TG, Kassem M. Regulation of human skeletal stem cells differentiation by Dlk1/Pref-1. J Bone Miner Res. 2004;19:841–852. - PubMed
    1. Akiyama H, Lyons JP, Mori-Akiyama Y, Yang X, Zhang R, Zhang Z, Deng JM, Taketo MM, Nakamura T, Behringer RR, et al. Interactions between Sox9 and beta-catenin control chondrocyte differentiation. Genes Dev. 2004;18:1072–1087. - PMC - PubMed
    1. Bachmann E, Krogh TN, Hojrup P, Skjodt K, Teisner B. Mouse fetal antigen 1 (mFA1), the circulating gene product of mdlk, pref-1 and SCP-1: isolation, characterization and biology. J Reprod Fertil. 1996;107:279–285. - PubMed
    1. Bi W, Huang W, Whitworth DJ, Deng JM, Zhang Z, Behringer RR, de Crombrugghe B. Haploinsufficiency of Sox9 results in defective cartilage primordia and premature skeletal mineralization. Proc Natl Acad Sci U S A. 2001;98:6698–6703. - PMC - PubMed
    1. da Rocha ST, Ferguson-Smith AC. Genomic imprinting. Curr Biol. 2004;14:R646–649. - PubMed

Publication types

MeSH terms