. 2009 Apr;136(4):1317-27, e1-2.
doi: 10.1053/j.gastro.2008.12.051. Epub 2008 Dec 27.

Intestinal vitamin D receptor is required for normal calcium and bone metabolism in mice

Affiliations

Intestinal vitamin D receptor is required for normal calcium and bone metabolism in mice

Yingben Xue et al. Gastroenterology. 2009 Apr.

Abstract

Background & aims: Vitamin D receptor (VDR)-knockout mice develop severe hypocalcemia and rickets, accompanied by disruption of active intestinal calcium absorption. To specifically study the effects of VDR in intestinal calcium absorption, we investigated whether restoration of intestinal VDR is sufficient to recover the phenotype of VDR-knockout mice.

Methods: We generated mice with intestine-specific transgenic expression of human VDR and crossed them to VDR knockout mice. The intestine, kidney, and bone phenotypes of the VDR- knockout mice with intestine-specific expression of human VDR (knockout/transgenic [KO/TG]) were analyzed.

Results: Transgenic expression of VDR in the intestine of VDR-knockout mice normalized duodenal vitamin D-regulated calcium absorption as well as vitamin D-regulated calcium binding protein D9k and TRPV6 gene expression in the duodenum and proximal colon. As a result, animal growth and the serum levels of calcium and parathyroid hormone were normalized in KO/TG mice. Other phenotypes were revealed when calcium metabolism was normalized in KO/TG mice: serum 1,25 dihydroxyvitamin D levels were higher in KO/TG mice than normal mice owing to reduced renal expression of the vitamin D-degrading enzyme CYP24, urinary calcium excretion was higher and associated with lower renal calcium binding protein D9k and calcium binding protein D28k than normal mice, and bone density and volume increased in KO/TG compared with normal mice owing to increased mineral apposition rate and osteoblast number.

Conclusions: Intestinal VDR and vitamin D-regulated intestinal calcium absorption are critical for controlling whole-body calcium metabolism in growing mice. Normalizing intestinal calcium absorption and metabolism reveals essential roles for VDR in control of bone formation and renal control of serum 1,25(OH)2D and urinary calcium excretion.


Conflict of interest statement

Conflicts of interest: There are no conflicts of interest to disclose.

Figures

Figure 1
Figure 1. Generation of intestine-specific, human VDR expressing, transgenic mice
(A) Transgene construct. A 12.4 kb villin promoter/enhancer was used to drive expression of a hemaglutinin (HA)–tagged–human VDR cDNA transgene in the intestine. Primers P1 and P2 were used for genotyping; primers P3 and P2 were used for assessing transgene mRNA levels. (B) Genotyping of transgenic offspring yields a 347 bp PCR product. Wild type mice = W; transgenic mice = T. (C) Transgene mRNA expression in intestinal segments of wild type (WT) and high transgene expressing mice (TG(H)) (Dd, duodenum; Je, jejunum; IL, ileum; Ce, cecum; CoP, proximal colon; CoD, distal colon). Transgene mRNA = 392 bp PCR product. (D) Transgene mRNA expression in a survey of mouse tissues.
Figure 2
Figure 2. Characterization of transgene mRNA and protein levels in two transgenic lines
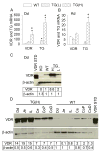
Transgene (TG) and total VDR mRNA levels in duodenum (A) and kidney (B) of wild-type (WT), low transgene-expressing, TG(L), and high transgene-expressing, TG(H), mouse lines were determined. Bars represent the mean ± SEM, n=4. * p<0.05 compared with WT, + p<0.05 compared with TG(L). (C) Total VDR protein levels in duodenum and (D) in different segments of intestine in WT and TG(H) mice were determined using a rat anti-VDR antibody by Western blot analysis as described in Materials and Methods. The band density values were measured by image J and are shown on the Western blot image relative to the values for the WT duodenum. (VDR STD: vitamin D receptor protein standard).
Figure 3
Figure 3. Gross appearance, growth curves and serum chemistries of VDR+/-, KO, KO/TG mice
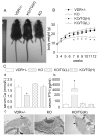
(A) Physical appearance and (B) Growth curves of 12-wk-old, male heterozygotes (VDR+/-), VDR knockout (KO), and KO mice recovered with high or low transgene expression, KO/TG(L) or KO/TG(H). Symbols represent the mean ± SEM, n=8, * p<0.05 compared with VDR+/- mice. (C) (a) serum calcium (Ca) and (b) parathyroid hormone (PTH) levels. Each value is the mean ± SEM (n=8 per genotype). * p<0.05 compared with VDR+/- mice. (c) Representative H&E stained histologic sections of parathyroid glands (arrows) and adjacent thyroid tissue. Original magnification=10X, scale bar = 254 μm.
Figure 4
Figure 4. Intestinal phenotype of VDR+/-, KO and KO/TG mice
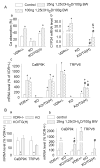
(A) Duodenal Ca absorption (a), CYP24 (b), calbindin D9k (CaBP9K), and TRPV6 (c) mRNA levels in 8-wk-old female VDR+/-, KO and KO/TG(H) mice 9 h after treatment with 25 ng or 100 ng 1,25(OH)2D/100 g body weight or vehicle (control). Bars represent the mean ± SEM, n=6-8. (B) CaBP9K, and TRPV6 mRNA levels in the proximal colon of 12-wk-old male VDR+/-, KO and KO/TG(H) mice (a) and in 8-wk-old female VDR+/-, KO and KO/TG(H) mice (b) 9 h after treatment with 25 ng 1,25(OH)2D/100 g body weight or vehicle (control). Each value is the mean ± SEM (n=6-8 per genotype). * p<0.05 compared with control-treated VDR+/-, # p<0.05 compared with 1,25(OH)2D-treated VDR+/- mice, + p<0.05 compared with control-treated KO/TG(H), $ p<0.05 compared with 25 ng/100g BW 1,25(OH)2D treated KO/TG(H). mRNA levels were assessed by real time PCR analysis, normalized to the GAPDH mRNA level, and expressed relative to levels of VDR+/- mice.
Figure 5
Figure 5. Renal phenotypes of VDR+/-, KO and KO/TG mice
(A) 12-wk old male VDR+/-, KO and KO/TG(L) and KO/TG(H) were examined for basal levels of: (a) serum 1,25(OH)2D, (b) renal CYP27B1 and CYP24 mRNA levels, (c) Urine calcium (Ca)/creatinine ratio, and (d) Renal calbindin D9k (CaBP9K) and calbindin D28k (CaBP28K) mRNA level. Each value is the mean ± SEM (n=8 per genotype). * p<0.05 compared with VDR+/- mice, # p<0.05 compared with KO mice, + p<0.05 compared with KO/TG(L) mice. (B) 8-wk-old female VDR+/-, KO and KO/TG(H) mice treated with 25 ng 1,25(OH)2D/100 g body weight or vehicle (control) for 9 h and renal RNA was examined for: (a) CYP24, (b) CYP27B1 and (c) TRPV5 mRNA levels by real-time RT–PCR analysis. Values were normalized to GAPDH mRNA level and are expressed relative to levels in control-treated VDR+/- mice. Bars represent the mean ± SEM, n=6-8. * p<0.05 compared with control-treated VDR+/- mice, # p<0.05 compared with 1,25(OH)2D-treated VDR+/- mice, + p<0.05 compared with control-treated KO/TG(H).
Figure 6
Figure 6. Skeletal phenotype of VDR+/-, KO, KO/TG(L) and KO/TG(H) mice
(A) Femoral bone mineral density (BMD) of 12-wk-old male of VDR+/-, KO and KO/TG(L) and KO/TG(H) was determined using dual energy x-ray absorption (DEXA). Bars represent the mean ± SEM, n=8. * p<0.05 compared with VDR+/- mice. (B) Representative contact radiographs of the femurs. Arrows are pointing to epiphysis, metaphysis and diaphysis (left to right).
Figure 7
Figure 7. Static and dynamic histomorphormetric analysis of VDR+/-, KO and KO/TG(H) mice
Decalcified paraffin-embedded femoral sections from 12-wk-old male VDR+/-, KO and KO/TG(H) were examined for (A, F a) trabecular bone volume (trabecular bone volume/total tissue volume) by total collagen staining; (D, F d) osteoblast number (cell number/tissue area, #/mm2) from H&E stained sections; and (E, F e) osteoclast number (cell number/tissue area, #/mm2) from TRAP staining. Calcified, plastic-embedded femoral sections from 8-wk-old female VDR+/-, KO and KO/TG(H) mice treated twice with calcein were used for (B, F b) mineralization (osteoid volume/total bone volum, OV/BV) from von Kossa staining and (C, F c) mineral apposition rate (MAR). Representative micrographs of histological sections are shown in the left panels (A, B, C, D, E). The original magnification in these sections is: 4, 40, 20, 60 and 40X, respectively and the scale bars represent 254, 127, 100, 127, and 127 μm, respectively. Arrows are pointing to growth plate (A), osteoid (B), calcein labeling (C), osteoblast (D) and osteoclast (E). (F) Quantification of these data is presented in the graphs. Bars represent the mean ± SEM, n=8. * p<0.05 compared with VDR+/- mice, # p<0.05 compared with KO mice.

References

    1. Fleet JC. Molecular Regulation of Calcium Metabolism. In: Weaver CM, Heaney RP, editors. Calcium in Human Health. Totowa, NJ: Humana Press; 2006. pp. 163–190.
    1. Wood RJ, Fleet JC, Cashman K, et al. Intestinal calcium absorption in the aged rat: evidence of intestinal resistance to 1,25(OH)2 vitamin D. Endocrinology. 1998;139:3843–3848. - PubMed
    1. Song Y, Peng X, Porta A, et al. Calcium transporter 1 and epithelial calcium channel messenger ribonucleic acid are differentially regulated by 1,25 dihydroxyvitamin D3 in the intestine and kidney of mice. Endocrinology. 2003;144:3885–3894. - PubMed
    1. Meyer MB, Watanuki M, Kim S, et al. The human transient receptor potential vanilloid type 6 distal promoter contains multiple vitamin D receptor binding sites that mediate activation by 1,25-dihydroxyvitamin D3 in intestinal cells. Mol Endocrinol. 2006;20:1447–1461. - PubMed
    1. Bronner F, Pansu D, Stein WD. An analysis of intestinal calcium transport across the rat intestine. Am J Physiol. 1986;250:G561–G569. - PubMed

Publication types

MeSH terms