. 2009 May 1;284(18):11953-62.
doi: 10.1074/jbc.M808176200. Epub 2009 Mar 2.

Independent beta-arrestin2 and Gq/protein kinase Czeta pathways for ERK stimulated by angiotensin type 1A receptors in vascular smooth muscle cells converge on transactivation of the epidermal growth factor receptor

Affiliations

Independent beta-arrestin2 and Gq/protein kinase Czeta pathways for ERK stimulated by angiotensin type 1A receptors in vascular smooth muscle cells converge on transactivation of the epidermal growth factor receptor

Jihee Kim et al. J Biol Chem. .

Abstract

Recent studies in receptor-transfected cell lines have demonstrated that extracellular signal-regulated kinase (ERK) activation by angiotensin type 1A receptor and other G protein-coupled receptors can be mediated by both G protein-dependent and beta-arrestin-dependent mechanisms. However, few studies have explored these mechanisms in primary cultured cells expressing endogenous levels of receptors. Accordingly, here we utilized the beta-arrestin biased agonist for the angiotensin type 1A receptor, SII-angiotensin (SII), and RNA interference techniques to investigate angiotensin II (ANG)-activated beta-arrestin-mediated mitogenic signaling pathways in rat vascular smooth muscle cells. Both ANG and SII induced DNA synthesis via the ERK activation cascade. Even though SII cannot induce calcium influx (G protein activation) after receptor stimulation, it does cause ERK activation, although less robustly than ANG. Activation by both ligands is diminished by depletion of beta-arrestin2 by small interfering RNA, although the effect is more complete with SII. ERK activation at early time points but not later time points is strongly inhibited by those protein kinase C inhibitors that can block protein kinase Czeta. Moreover, ANG- and SII-mediated ERK activation require transactivation of the epidermal growth factor receptor via metalloprotease 2/9 and Src kinase. beta-Arrestin2 facilitates ANG and SII stimulation of Src-mediated phosphorylation of Tyr-845 on the EGFR, a known site for Src phosphorylation. These studies delineate a convergent mechanism by which G protein-dependent and beta-arrestin-dependent pathways can independently mediate ERK-dependent transactivation of the EGFR in vascular smooth muscle cells thus controlling cellular proliferative responses.


Figures

FIGURE 1.
FIGURE 1.
Mobilization of calcium, DNA synthesis, and phosphorylation of ERK stimulated by ANG and SII in VSMCs. A, VSMCs were loaded with the calcium-binding dye Fura-2, and stimulated either with ANG (100 nm) or SII (10 μm) in the presence or absence of pretreatment with the AT1R antagonist (AT1RB) valsartan (50 μm) or AT2R antagonist (AT2RB) PD123319 (30 μm). Calcium fluorimetric traces are shown with the 340/380 nm excitation ratio (y axis) plotted as a function of time (x axis). Results displayed are mean ± S.E. of three independent experiments. B, VSMCs were serum starved for 24 h to arrest cycling and pretreated with dimethyl sulfoxide (DMSO) or MEK inhibitor PD98056 (20 μm). ANG (100 nm), SII (10 μm), or EGF (10 ng/ml) along with 3H-labeled thymidine were then added to the media, and 24 h later cells were harvested as described under “Experimental Procedures.” NS indicates no stimulation. Results depicted represent the mean ± S.E. of count per minute (cpm) values from four independent experiments. Statistical analysis was done using a one-way ANOVA (PRISM software) to correct for multiple comparisons (Bonferroni's multiple comparison test) with post test. The PD98056-pretreated condition shows significant reduction compare with the dimethyl sulfoxide-pretreated condition for each stimulant (*, p < 0.05). C, VSMCs with endogenous AT1R were treated with 100 nm ANG or 10 μm SII for the indicated times. Equal amounts of cell lysate were separated by SDS-PAGE and analyzed for phosphorylated ERK (p-ERK) and total ERK (ERK) by Western blotting. IB, immunoblot. D, signals were quantified by densitometry and p-ERK was normalized to a loading control (ERK). p-ERK activation was expressed as percentage of the maximal phosphorylated ERK obtained by ANG stimulation at 5 min. Each data point represents the mean ± S.E. from eight independent experiments.
FIGURE 2.
FIGURE 2.
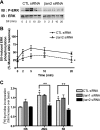
Effects of β-arrestin RNAi on ANG-mediated phosphorylation of ERK. VSMCs were transfected with the control (CTL), β-arrestin1 and -2 siRNAs using Lipofectamine 2000. A, representative Western blot for expression of β-arrestins after siRNA transfection was shown. β-Arrestin1 and -2 were detected by immunoblotting (IB) with rabbit polyclonal anti-β-arrestin1 (A1CT) and anti-β-arrestin2 (A2CT) antibodies, respectively. Immunoblotting with actin was shown as a loading control. B–D, serum-starved cells were treated with 100 nm ANG for the indicated times and cell lysates were analyzed for phosphorylated ERK (p-ERK) and total ERK (ERK). B, representative Western blot for ANG induced p-ERK and ERK in siRNA-transfected VSMCs was shown. C and D, signals were quantified by densitometry and p-ERK was normalized to a loading control (ERK). The signal at each point is expressed as percentage of the maximal p-ERK signal (5 min) in CTL siRNA-transfected cells. The graphs represent mean ± S.E. from six independent experiments. Statistical analysis was done using a one-way ANOVA (PRISM software) to correct for multiple comparisons (Bonferroni's multiple comparison test) with post test. The siRNA transfected condition shows significant differences compared with control siRNA-transfected cells at each time point (*, p < 0.05; **, p < 0.01).
FIGURE 3.
FIGURE 3.
Effects of β-arrestin RNAi on SII-mediated phosphorylation of ERK. A and B, VSMCs were transfected with control (CTL) or β-arrestin2 siRNAs using Lipofectamine 2000. Serum-starved cells were treated with 10 μm SII for the indicated times and cell lysates were analyzed for phosphorylated ERK (p-ERK) and total ERK (ERK). A, representative Western blot for SII-induced p-ERK and total ERK in siRNA-transfected VSMCs was shown. B, signals were quantified by densitometry and p-ERK was normalized to a loading control (ERK). Signal at each point is expressed as percentage of ANG stimulated the maximal p-ERK signal at 5 min in control (CTL) siRNA-transfected cells as depicted in Fig. 2B. The graph represents mean ± S.E. from six independent experiments. Statistical analysis in each time point of kinetic graphs were determined by using a two-way ANOVA (Bonferroni's post test) between β-arrestin2 and control (CTL) siRNA-transfected cells (*, p < 0.05). C, VSMCs were transfected with control, β-arrestin1 or -2 siRNAs using Lipofectamine 2000 and then serum starved for 24 h to arrest cycling. ANG (100 nm) or SII (10 μm) along with 3H-labeled thymidine was then added to the media, and 24 h later cells were harvested as described under “Experimental Procedures.” NS indicates no stimulation. Results depicted represent the mean ± S.E. of fold-increase of basal counts per minute (cpm) values from three independent experiments. Statistical analysis was done using a one-way ANOVA (PRISM software) to correct for multiple comparisons (Bonferroni's post test). ANG and SII significantly increase thymidine incorporation compared with NS control (*, p < 0.05). Depletion of β-arrestin2 shows significant reduction on both ANG- and SII-mediated thymidine incorporation compared with its own agonist stimulation in the CTL siRNA-transfected condition (**, p < 0.05). IB, immunoblot.
FIGURE 4.
FIGURE 4.
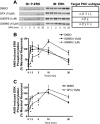
Effects of PKC inhibitors on ANG-stimulated phosphorylation of ERK. Serum-starved VSMCs were pretreated with vehicle (dimethyl sulfoxide, DMSO) or the indicated PKC inhibitors for 30 min, and then stimulated with 100 nm ANG for the indicated times. Western blots for phosphorylated ERK (p-ERK) and total ERK (ERK) were performed. A, representative p-ERK Western blots and targeted PKC subtypes for PKC inhibitors were presented. B and C, signals were quantified by densitometry and p-ERK was normalized to a loading control (ERK). The percentage of p-ERK was calculated for each time point and plotted as percentage of the maximal p-ERK signal with dimethyl sulfoxide at 5 min. Data represent the mean ± S.E. of four independent experiments. Statistical analysis was done using a one-way ANOVA (PRISM software) to correct for multiple comparisons (Bonferroni's post test). Pretreated conditions with PKC inhibitors show the significant differences compared with dimethyl sulfoxide-treated cells at the indicated time point (*, p < 0.05). IB, immunoblot.
FIGURE 5.
FIGURE 5.
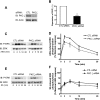
Effects of PKCζ RNAi on AT1R-mediated phosphorylation of ERK. VSMCs were transfected with control (CTL) siRNA or siGENOME ON-TARGET plus a set of four rat PKCζ siRNAs (Dharmacon) using Lipofectamine 2000. A, representative Western blot for expression of PKCζ and actin after siRNA transfection was shown. B, the expression levels of PKCζ after siRNA transfection were measured by Western blot and normalized with its loading control (actin). Results are shown as % of expression of PKCζ in CTL siRNA cells. Data represent mean ± S.E. from four independent experiments (*, p < 0.05). C–F, siRNA-transfected and serumstarved VSMCs were stimulated by 100 nm ANG or 10 μm SII for the indicated times and cell lysates were analyzed for phosphorylated ERK (p-ERK) and total ERK (ERK). C and E, representative p-ERK and ERK Western blots were presented for ANG (C) and SII (E) stimulation. D and F, signals were quantified by densitometry and p-ERK was normalized to a loading control (ERK). Data represent mean ± S.E. from four independent experiments. Signal at each point is expressed as percentage of the maximal p-ERK signal-stimulated ANG for 5 min in CTL siRNA VSMCs. D, statistical analysis was done using a one-way ANOVA (PRISM software) to correct for multiple comparisons (Bonferroni's post test) for ANG-induced ERK activation in PKCζ siRNA-transfected cells compared with CTL siRNA-transfected cells at each time point (* p < 0.05). F, SII-induced ERK activation was not significantly different between PKCζ siRNAs and CTL siRNA-transfected VSMCs. IB, immunoblot.
FIGURE 6.
FIGURE 6.
EGFR-dependent activation of ERK mediated by ANG and SII stimulation. A–F, VSMCs were transfected with control (CTL) or β-arrestin2 siRNAs using Lipofectamine 2000. Serum-starved VSMCs were pretreated with dimethyl sulfoxide (DMSO) or 250 nm AG1478 and then stimulated with 100 nm ANG or 10 μm SII for the indicated times. Equal amounts of cell lysate were separated by SDS-PAGE and analyzed for phosphorylated ERK (p-ERK) and total ERK (ERK) by Western blotting. Signals were quantified by densitometry and p-ERK was normalized to a loading control (ERK). Signal at each point is expressed as percentage of the maximal p-ERK signal (ANG for 5 min) in a dimethyl sulfoxide (DMSO)-treated CTL siRNA-transfected condition. A and C, representative Western blots of p-ERK and ERK from ANG-stimulated CTL siRNA (A) and β-arrestin2 siRNAs-transfected VSMCs (C) are presented. B and D, data represent mean ± S.E. from six independent experiments in panels A and C. Statistical analysis was done using a one-way ANOVA (PRISM software) to correct for multiple comparisons (Bonferroni's post test). *, p < 0.05 compared with the dimethyl sulfoxide-treated condition at each time point. E, representative SII-induced p-ERK and ERK Western blots from VSMCs pretreated with DMSO or AG1478. F, data represent mean ± S.E. from six independent experiments. Statistical analysis in each time point of kinetic graphs were determined by using a two-way ANOVA (Bonferroni's post test) between dimethyl sulfoxide and AG1478-treated cells (*, p < 0.05). G and H, serum-starved VSMCs were pretreated with dimethyl sulfoxide or 10μm BiPS and then stimulated with 100 nm ANG or 10 μm SII for 5 min. Equal amounts of cell lysate were separated by SDS-PAGE and analyzed for p-ERK and ERK by Western blotting. Signals were quantified by densitometry and p-ERK was normalized to a loading control (ERK). Signals at each condition were expressed as percentage of the maximal p-ERK obtained at 5 min for ANG stimulation in DMSO-treated VSMCs. Each data point represents the mean ± S.E. from four independent experiments. Statistical analysis was done using a one-way ANOVA (PRISM software) to correct for multiple comparisons (Bonferroni's post test). *, p < 0.05, compared with the DMSO-pretreated condition for each stimulant. I, VSMCs were serum starved for 24 h to arrest cycling and pretreated with dimethyl sulfoxide or 250 nm AG1478. ANG (100 nm) or SII (10 μm) along with 3H-labeled thymidine was then added to the media, and 24 h later cells were harvested as described under “Experimental Procedures.” Results depicted represent the mean ± S.E. of fold-increase over basal counts per minute (cpm) from four independent experiments. Statistical analysis was done using a one-way ANOVA (PRISM software) to correct for multiple comparisons (Bonferroni's post test). The AG1478-pretreated condition shows significant reduction compared with the dimethyl sulfoxide-pretreated condition for each stimulant (*, p < 0.05). IB, immunoblot.
FIGURE 7.
FIGURE 7.
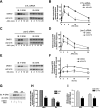
Roles of Src in ANG- and SII-induced activation of ERK and EGFR. A and B, VSMCs were pretreated with DMSO or 10 μm PP2 (Src inhibitor) and then treated with 100 nm ANG or 10 μm SII for 5 min. Equal amounts of cell lysate were separated by SDS-PAGE and analyzed for phosphorylated ERK (p-ERK) and total ERK (ERK) by Western blotting. Signals were quantified by densitometry and p-ERK was normalized to a loading control (ERK). Signal at each point is expressed as percentage of the maximal p-ERK signal (ANG for 5 min) in dimethyl sulfoxide (DMSO)-treated VSMCs. A, representative p-ERK and ERK Western blots in dimethyl sulfoxide or PP2-pretreated VSMCs were presented. B, each data point represents the mean ± S.E. from four independent experiments. Statistical analysis was done using a one-way ANOVA (PRISM software) to correct for multiple comparisons (Bonferroni's post test). *, p < 0.05, compared with dimethyl sulfoxide treatment for each stimulant. C and D, VSMCs were transfected with the indicated siRNAs using Lipofectamine 2000. Serum-deprived VSMCs were incubated with 100 nm ANG and 10 μm SII for 2 min and immunoprecipitated with EGFR antibody. EGFRY845 phosphorylation was determined by Western analysis with Tyr(P)-845-specific antibody and EGFR antibody. EGFRY845 phosphorylation was quantified by densitometry and normalized to a loading control (EGFR). C, representative Western blots for EGFRY845 and EGFR in siRNA-transfected VSMCs were presented. D, data are presented as fold-increase over basal (the mean ± S.E.) from six independent experiments. Statistical analysis was done using a one-way ANOVA (PRISM software) to correct for multiple comparisons (Bonferroni's post test). ANG and SII significantly increase phosphorylation of EGFR at Tyr-845 compared with no stimulation (NS) control (*, p < 0.05). Depletion of β-arrestin2 shows a significant reduction on both ANG and SII mediated phosphorylation of EGFR at Tyr-845 compared with its own agonist stimulation in the control siRNA-transfected condition (**, p < 0.05).

Similar articles

Cited by

References

    1. Drake, M. T., Shenoy, S. K., and Lefkowitz, R. J. (2006) Circ. Res. 99 570–582 - PubMed
    1. DeWire, S. M., Ahn, S., Lefkowitz, R. J., and Shenoy, S. K. (2007) Annu. Rev. Physiol. 69 483–510 - PubMed
    1. Demoliou-Mason, C. D. (1998) Biol. Signals Recept. 7 90–97 - PubMed
    1. Nozawa, Y., Matsuura, N., Miyake, H., Yamada, S., and Kimura, R. (1999) Life Sci. 64 2061–2070 - PubMed
    1. Wassmann, S., and Nickenig, G. (2006) J. Hypertens. 24 S15–S21 - PubMed

Publication types

MeSH terms

LinkOut - more resources