. 2009 Nov;19(11):2640-50.
doi: 10.1093/cercor/bhp015. Epub 2009 Mar 2.

Cortical and subcortical mechanisms for precisely controlled force generation and force relaxation

Affiliations

Cortical and subcortical mechanisms for precisely controlled force generation and force relaxation

Matthew B Spraker et al. Cereb Cortex. 2009 Nov.

Abstract

Gripping objects during everyday manual tasks requires the coordination of muscle contractions and muscle relaxations. The vast majority of studies have focused on muscle contractions. Although previous work has examined the motor cortex during muscle relaxation, the role of brain areas beyond motor cortex remains to be elucidated. The present study used functional magnetic resonance imaging to directly compare slow and precisely controlled force generation and force relaxation in humans. Contralateral primary motor cortex and bilateral caudate nucleus had greater activity during force generation compared with force relaxation. Conversely, right dorsolateral prefrontal cortex (DLPFC) had greater activity while relaxing force compared with generating force. Also, anterior cingulate cortex had greater deactivation while relaxing force compared with generating force. These findings were further strengthened by the fact that force output parameters such as the amplitude, rate, duration, variability, and error did not affect the brain imaging findings. These results demonstrate that the neural mechanisms underlying slow and precisely controlled force relaxation differ across prefrontal-striatal and motor cortical-striatal circuits. Moreover, this study demonstrates that the DLPFC is not only involved in slow and precisely controlled force generation, but has greater involvement in regulating slow and precisely controlled muscle relaxation.


Figures

Figure 1.
Figure 1.
(A) Depicts the experimental paradigm, which includes 4, 78-s task blocks and 5, 30-s rest blocks. (B) Task blocks included a precisely controlled force generation sequence repeated 5 times during 30 s (black) and a precisely controlled force relaxation sequence repeated 5 times during 30 s (gray). The force generation and force relaxation conditions were separated by 18 s of rest. (C) Recorded force trace from a single subject performing a precisely controlled force generation sequence (left) and a precisely controlled force relaxation sequence (right). All contractions were approximately 5 s long and had peak force amplitude of approximately 15% MVC.
Figure 2.
Figure 2.
(A) Force amplitude. (B) Duration of the ramp plus hold period. (C) Duration of the ramp period. (D) Rate of change of force. (E) Standard deviation of force. (F) Absolute error. Mean parameters are plotted for each subject (S1-S11) across trials and for the group mean for the precisely controlled force generation (filled) and precisely controlled force relaxation (empty) sequences. Error bars indicate standard deviation across trials for individual subjects (S1-S11) and standard error for the group mean. Force amplitude, duration of the ramp period, rate of change of force, standard deviation of force, and absolute error were consistent between conditions. The force generation sequence was slightly longer than the force relaxation sequence. **Designates P < 0.01.
Figure 3.
Figure 3.
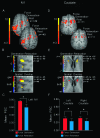
Results from the voxel-wise analysis and statistical ROI analysis for brain areas that had increased BOLD activation during the precisely controlled force generation sequence compared with the precisely controlled force relaxation sequence. (AC) Depict the results for left M1, whereas (D)–(F) depict the results for bilateral caudate. (A) Axial slices showing BOLD activation detected by voxel-wise analysis for force generation (top) and force relaxation (bottom) compared with rest. The color bar ranges from t = 3 to t = 10 with a group activation threshold of P < 0.05, corrected. (B, top) Depicts the results of the voxel-wise comparison of force generation versus force relaxation (P < 0.05, corrected). The white box corresponds to the white box in (A) and depicts x = −60 to −25 and y = −10 to −40 for a single slice z = +49. The distance between tick marks represents 5 mm on the x- and y-axis. The color bar ranges from t = −7 (blue) to t = + 7 (yellow), where yellow voxels have greater BOLD signal during force generation than during force relaxation. (B, bottom) Depicts whether voxels with a task difference identified via the voxel-wise analysis (B, top) are significantly active during the force generation sequence minus rest (red), force relaxation sequence minus rest (blue), or both sequences minus rest (yellow). (C) Plot of group mean percent signal change in the left M1 ROI for the force generation (red) and force relaxation (blue) sequence. (D) Axial slices showing BOLD activation detected by the voxel-wise analysis for force generation (top) and force relaxation (bottom) compared with rest. The color bar is identical to that in (A). (E, top) The results of the voxel-wise comparison of force generation versus force relaxation are shown for bilateral caudate nucleus (P < 0.05, corrected). The white box corresponds to the white in (D) and depicts x = −25 to +25 and y = +28 to −12 for a single slice z = +11. The distance between tick marks represents 5 mm on the x- and y-axis. The color bar is identical to that in (B, top), where yellow voxels have greater BOLD signal during force generation than force relaxation. (E, bottom) Depicts whether voxels with a task difference identified via the voxel-wise analysis (E, top) are significantly active during the force generation sequence minus rest (red), force relaxation sequence minus rest (blue), or both sequences minus rest (yellow). (F) Plot of group mean percent signal change in left and right caudate ROIs for the force generation (red) and force relaxation (blue) sequence. *Designates P < 0.05.
Figure 4.
Figure 4.
Results from the voxel-wise analysis and statistical ROI analysis for brain areas that had greater change in BOLD activation during the force relaxation sequence than during the force generation sequence. (AC) Depict the results for right DLPFC, whereas (DF) depict the results for bilateral ACC. (A) Axial slices showing positive BOLD activation detected by voxel-wise analysis for force generation (top) and force relaxation (bottom) compared with rest. The color bar ranges from t = 3 to t = 10 with a group activation threshold of P < 0.05, corrected. (B, top) Depicts the results of the voxel-wise comparison of force generation versus force relaxation (P < 0.05, corrected). The white box corresponds to the white box in (A) and depicts x = +30 to +60 and y = +53 to +23 for a single slice z = +31. The distance between tick marks represents 5 mm on the x- and y-axis. The color bar ranges from t = −7 (blue) to t = + 7 (yellow), where blue voxels have greater BOLD signal during force relaxation than force generation. (B, bottom) Depicts whether voxels with a task difference identified via the voxel-wise analysis (B, top) are significantly active during the force generation sequence minus rest (red), force relaxation sequence minus rest (blue), or both sequences minus rest (yellow). (C) Plot of group mean percent signal change in the right DLPFC ROI for the force generation (red) and force relaxation (blue) task. (D) Axial slices showing BOLD deactivation detected by the voxel-wise analysis for force generation (top) and force relaxation (bottom) compared with rest. The color bar ranges from t = −3 to t = −10. (E, top) The results of the voxel-wise comparison of force generation versus force relaxation are shown for bilateral ACC (P < 0.05, corrected). The white box corresponds to the white box in (D) and depicts x = −20 to +20 and y = +50 to +15 for a single slice z = +27. The distance between tick marks represents 5 mm on the x- and y-axis. The color bar is identical to that in Figure 3B (top), where yellow voxels have greater BOLD deactivation during force relaxation than force generation. (E, bottom) Depicts whether voxels with a task difference identified via the voxel-wise analysis (B, top) are significantly deactivated during the force generation sequence minus rest (red), force relaxation sequence minus rest (blue), or both sequences minus rest (yellow). (F) Plot of group mean percent signal change in the bilateral ACC ROI for the force generation (red) and force relaxation (blue) condition. *Designates P < 0.05.

Similar articles

Cited by

References

    1. Anderson JR, Qin Y, Jung KJ, Carter CS. Information-processing modules and their relative modality specificity. Cogn Psychol. 2007;54:185–217. - PubMed
    1. Bonnard M, Gallea C, De Graaf JB, Pailhous J. Corticospinal control of the thumb-index grip depends on precision of force control: a transcranial magnetic stimulation and functional magnetic resonance imagery study in humans. Eur J Neurosci. 2007;25:872–880. - PubMed
    1. Buccolieri A, Abbruzzese G, Rothwell JC. Relaxation from a voluntary contraction is preceded by increased excitability of motor cortical inhibitory circuits. J Physiol. 2004;558:685–695. - PMC - PubMed
    1. Corcos DM, Chen CM, Quinn NP, McAuley J, Rothwell JC. Strength in Parkinson's disease: relationship to rate of force generation and clinical status. Ann Neurol. 1996;39:79–88. - PubMed
    1. De Luca CJ, LeFever RS, McCue MP, Xenakis AP. Behaviour of human motor units in different muscles during linearly varying contractions. J Physiol. 1982;329:113–128. - PMC - PubMed

Publication types