

Neighborhood-level cohesion and disorder: measurement and validation in two older adult urban populations
- PMID: 19255089
- PMCID: PMC2670251
- DOI: 10.1093/geronb/gbn041
Neighborhood-level cohesion and disorder: measurement and validation in two older adult urban populations
Abstract
Objectives: Drawing from collective efficacy and social disorganization theories, we developed and validated measures of neighborhood-level social processes.
Methods: Data came from 2 large, population-based cohort studies of urban-dwelling older adults, the Chicago Neighborhood and Disability Study (CNDS, n = 3,882) and the Baltimore Memory Study (BMS, n = 1,140). Data on neighborhood social processes were collected from residents using a standardized instrument identical in the 2 studies. We used confirmatory factor analysis and descriptive statistics to explore reliability and validity of the neighborhood-level measures.
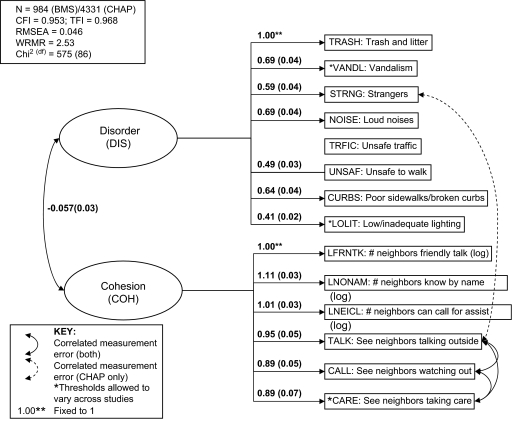
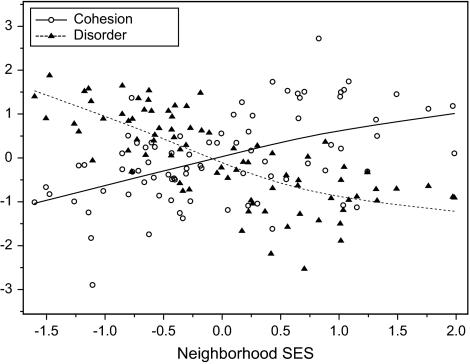
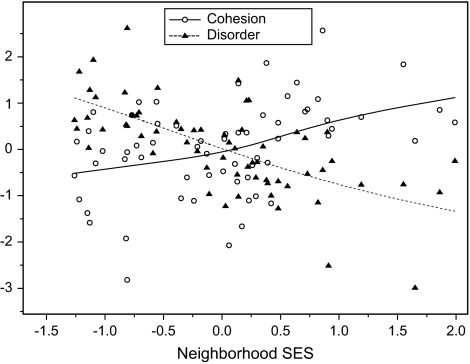
Results: Confirmatory factor analysis indicated 2 latent factors: social cohesion and exchange (i.e., observations of and interactions with neighbors) and social and physical disorder (i.e., neighborhood problems and unsafe conditions). Neighborhood-level measures of cohesion and disorder showed moderate to high levels of internal consistency (alphas = .78 and .85 in CNDS and .60 and .88 in BMS). Inter-resident agreements were low (intra-neighborhood correlation coefficients = .08 and .11 in CNDS and .05 and .33 in BMS). Cohesion showed a modest, positive association with a composite measure of neighborhood socioeconomic status (SES). Disorder showed a strong, negative association with neighborhood SES.
Conclusions: Findings provide initial evidence of the reliability and construct validity of these neighborhood-level social process measures.
Figures
References
-
- Balfour JL, Kaplan GA. Neighborhood environment and loss of physical function in older adults: Evidence from the Alameda County Study. American Journal of Epidemiology. 2002;155:507–515. - PubMed
-
- Berkman LF, Glass T. Social integration, social networks, social support, and health. In: Berkman LF, Kawachi I, editors. Social epidemiology. Oxford, England: Oxford University Press; 2000. pp. 137–173.
-
- Bienias JL, Beckett LA, Bennett DA, Wilson RS, Evans DA. Design of the Chicago Health and Aging Project (CHAP) Journal of Alzheimer's Disease. 2003;5:349–355. - PubMed
-
- Brooks-Gunn J, Duncan GJ, Klebanov PK, Sealand N. Do neighborhoods influence child and adolescent development. American Journal of Sociology. 1993;99:353–395.
-
- Browning CR, Cagney KA. Neighborhood structural disadvantage, collective efficacy, and self-rated physical health in an urban setting. Journal of Health and Social Behavior. 2002;43:383–399. - PubMed
Publication types
MeSH terms
Grants and funding
LinkOut - more resources
Full Text Sources
Medical
