. 2009 May;37(8):2434-48.
doi: 10.1093/nar/gkp029. Epub 2009 Mar 2.

Structural basis for the sequence-dependent effects of platinum-DNA adducts

Affiliations

Structural basis for the sequence-dependent effects of platinum-DNA adducts

Srinivas Ramachandran et al. Nucleic Acids Res. 2009 May.

Abstract

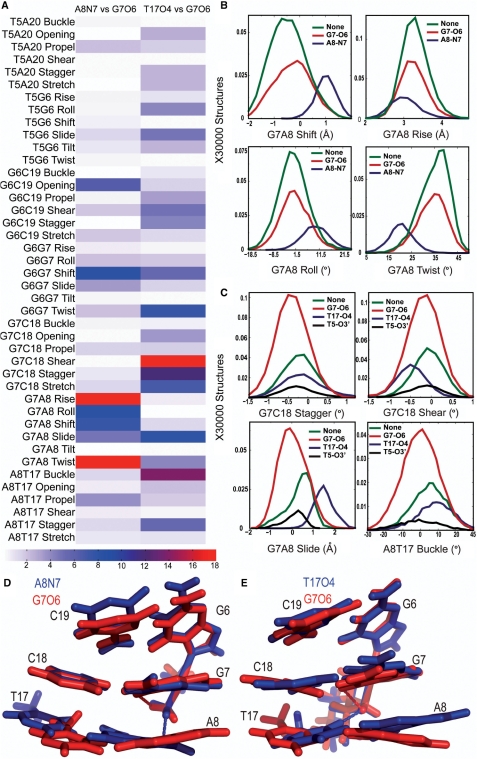
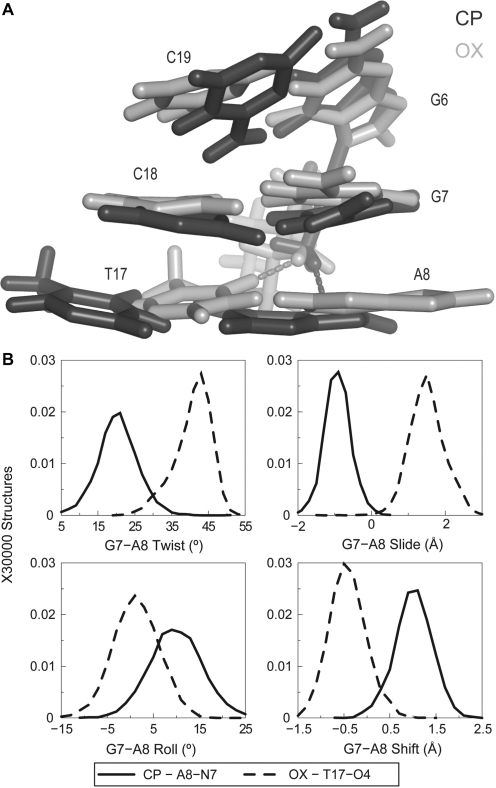
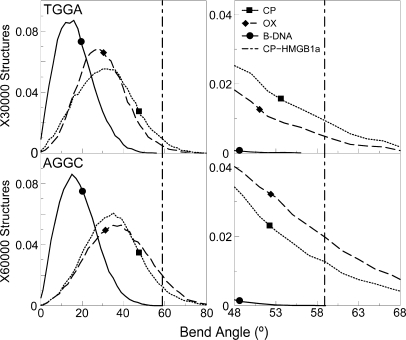
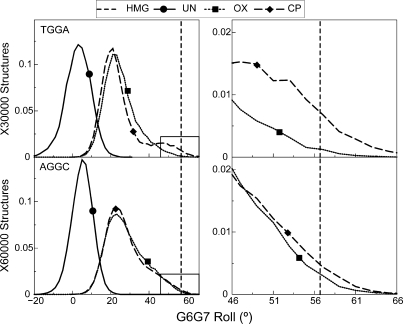
The differences in efficacy and molecular mechanisms of platinum based anti-cancer drugs cisplatin (CP) and oxaliplatin (OX) have been hypothesized to be in part due to the differential binding affinity of cellular and damage recognition proteins to CP and OX adducts formed on adjacent guanines in genomic DNA. HMGB1a in particular exhibits higher binding affinity to CP-GG adducts, and the extent of discrimination between CP- and OX-GG adducts is dependent on the bases flanking the adducts. However, the structural basis for this differential binding is not known. Here, we show that the conformational dynamics of CP- and OX-GG adducts are distinct and depend on the sequence context of the adduct. Molecular dynamics simulations of the Pt-GG adducts in the TGGA sequence context revealed that even though the major conformations of CP- and OX-GG adducts were similar, the minor conformations were distinct. Using the pattern of hydrogen bond formation between the Pt-ammines and the adjacent DNA bases, we identified the major and minor conformations sampled by Pt-DNA. We found that the minor conformations sampled exclusively by the CP-GG adduct exhibit structural properties that favor binding by HMGB1a, which may explain its higher binding affinity to CP-GG adducts, while these conformations are not sampled by OX-GG adducts because of the constraints imposed by its cyclohexane ring, which may explain the negligible binding affinity of HMGB1a for OX-GG adducts in the TGGA sequence context. Based on these results, we postulate that the constraints imposed by the cyclohexane ring of OX affect the DNA conformations explored by OX-GG adduct compared to those of CP-GG adduct, which may influence the binding affinities of HMG-domain proteins for Pt-GG adducts, and that these conformations are further influenced by the DNA sequence context of the Pt-GG adduct.


Figures

Scheme 1.
Scheme 1.
Dodecamer sequences used in simulations.
Figure 1.
Figure 1.
Comparison of centroid structures. Structural alignment of the centroid structures using only the atoms from the DNA part of the molecule from the simulations of CP-DNA in AGGC and TGGA sequence contexts (A), OX-DNA in AGGC and TGGA sequence context (B) and CP- and OX-DNA in TGGA sequence context (C). The structural alignment of the central four base-pairs of the centroid structures of CP-DNA in AGGC and TGGA sequence contexts (D), OX-DNA in AGGC and TGGA sequence context (E) and CP- and OX-DNA in TGGA sequence context (F).
Figure 2.
Figure 2.
Geometrical parameters of platinum. The distributions of the four angles around the square-planar platinum atom are plotted from the CP- and OX-TGGA simulations: 5′N7-Pt-3′N7 (A), 5′NHx-Pt-3′NHx (B), 5′N7-Pt-5′NHx (C), 3′N7-Pt-3′NHx (D). The Pt-amines at the 5′ and 3′ side of the adduct are denoted as 5′NHx and 3′NHx, respectively. The N7s of G6 and G7 that are involved in covalent bonds with Pt are denoted as 5′N7 and 3′N7, respectively. The frequency distribution histograms were calculated from the structures obtained at every picosecond over the final 6 ns of each equilibrated MD simulation, resulting in a total of 30 000 structures each for CP-, OX- and undamaged DNA. The distribution is plotted against the number of structures in the trajectory. The frequency distributions for CP- and OX-TGGA adducts are shown as a dashed line and solid line, respectively.
Figure 3.
Figure 3.
Dihedral angle involved in hydrogen bond formation. The dihedral angle describing the Pt-amine hydrogen orientation while forming hydrogen bond with adjacent DNA bases is shown for the G7-O6 hydrogen bond in CP-DNA in the AGGC sequence context (A), the A8-N7 hydrogen bond in CP-DNA in the TGGA sequence context (B) and the A5-N7 hydrogen bond in CP-DNA in the AGGC sequence context (C), respectively. OX has two hydrogens for each Pt-amine—equatorial (eq) and axial (ax). The distribution of the 3′N7-Pt-NHx-H dihedral angle is shown for the AGGC sequence context (D) and the TGGA sequence context (E). The distribution of the 5′N7-Pt-NHx-H dihedral angle is shown for the AGGC sequence context (F). The distribution of dihedral angles involving all the structures of an adduct are plotted in black, distribution of dihedral angles for structures with the G7-O6 hydrogen bond are plotted in red and that for structures with the hydrogen bond to adjacent base are plotted in blue. Similarly, distributions for OX-DNA are plotted as a dashed line while those for CP-DNA are plotted as a solid line. The frequency distribution histograms for the overall distributions were calculated from the final 30 000 structures (taken every picosecond) for the TGGA and 60 000 structures for the AGGC sequence contexts, for the CP-, OX- and undamaged DNA simulations as described in Figure 2. [Simulations in the AGGC sequence context were performed from two starting structures each as described in Sharma et al. (26).] The frequency distribution for a particular hydrogen bonded species was obtained from structures that formed that particular hydrogen bond. However, the normalization was performed over the full 30 000 structures to show the relative abundance of different hydrogen bonded species.
Figure 4.
Figure 4.
Helical parameters in the TGGA sequence context. The conformational differences in the central 4 bp for different hydrogen bonded species in the TGGA sequence context are represented at three different levels. The differences between two hydrogen bonded species in all the 42 parameters are shown in a heat map (A). For CP-DNA, we compare structures with G7-O6 hydrogen bond to structures with the A8-N7 hydrogen bond and for OX-DNA we compare structures with G7-O6 hydrogen bond to structures with the T17-O4 hydrogen bond. We represent the differences as the KS ratio, which is color-coded (The KS ratio decreases in the order of Red > Blue > White). Plots of histograms of the four helical parameters showing significant differences for different hydrogen bonded species of CP-DNA adduct (B) and OX-DNA adduct (C), are shown with the frequency distribution calculated as described before. The distribution for structures with no hydrogen bond is plotted in green, for structures with G7-O6 hydrogen bond in plotted in red and for structures with hydrogen bond to the adjacent base is plotted in blue. Alignment of 5′G6G7A8 3′ base pairs of the centroid structures forming the CP-G7-O6 hydrogen bond (red) and the CP-A8-N7 hydrogen bond (blue) (D) are shown. Alignment of 5′G6G7A8 3′ base pairs of the centroid structures forming the OX-G7-O6 hydrogen bond (red) and the OX-T17-O4 hydrogen bond (blue) (E) are also shown. The structures are aligned based on Pt-G6G7.
Figure 5.
Figure 5.
Differences in DNA conformation and helical parameters of A8-N7 and T17-O4 hydrogen bonded species in CP- and OX-DNA, respectively. (A) Alignment of the 5′G6G7A8 3′ base pairs of the centroid structures forming A8-N7 hydrogen bond in CP-DNA adduct and the T17-O4 hydrogen bond in the OX-DNA adduct is shown. The structures are aligned based on Pt-G6G7. (B) Plots of histograms of the four helical parameters showing greatest differences between the A8-N7 hydrogen bonded species in CP-DNA and T17-O4 hydrogen bonded species in OX-DNA are shown. The distributions of twist, slide, roll and shift parameters of the G7-A8 base-pair step are plotted because the greatest differences are in this base-pair step (data not shown). The solid line represents distribution of structures with CP-A8-N7 hydrogen bond while the dashed line represents distribution of structures with OX-T17-O4 hydrogen bond. The frequency distributions are calculated and normalized as described earlier.
Figure 6.
Figure 6.
Bend angle distributions of hydrogen-bonded species. The bend angle distributions of CP-, OX-GG adducts and undamaged DNA in the TGGA and the AGGC sequence context are plotted. The distribution for undamaged DNA is plotted as a solid line, the distribution for CP-DNA is plotted as a dotted line and that for OX-DNA is plotted as a dashed line. The bend angle of DNA in the crystal structure of CP-DNA bound to HMGB1a (21) is plotted as a vertical dashed line. The region of bend angle ±10° of the bend angle in the crystal structure of CP-DNA bound to HMGB1a is plotted alongside to highlight differences between CP- and OX-GG adducts.
Figure 7.
Figure 7.
Distribution of the G6-G7 roll. The distribution of G6-G7 roll, which is important for intercalation of Phe37 of HMGB1a between the G6-G7 base-pair step is plotted for the AGGC and the TGGA sequence contexts. The distributions of CP-, OX- and undamaged DNA are plotted in each sequence context. The distribution for undamaged DNA is plotted as a solid line, the distribution for CP-DNA is plotted as a dashed line and that for OX-DNA is plotted as a dotted line. The bend angle of DNA in the crystal structure of CP-DNA bound to HMGB1a (21) is plotted as a vertical dashed line. The region of roll ±10° of the roll in the crystal structure of CP-DNA bound to HMGB1a is plotted alongside to highlight differences between CP- and OX-DNA in the TGGA sequence context.
Figure 8.
Figure 8.
Distributions of the Pt-GG roll in the HMGB1a-Pt–DNA simulations. The distribution of the roll of the Pt-GG base-pair step, which is important for stacking of Phe37 of HMGB1a to the 3′G is plotted for the HMGB1a-Pt–DNA complexes in the AGGC and the TGGA sequence contexts. The distributions of the roll of CP- and OX-DNA are plotted for each sequence context. Distributions of adducts in the TGGA sequence context are plotted as solid lines, while the distributions of adducts in the AGGC sequence context are plotted as dashed lines. CP-DNA is plotted in black, while OX-DNA is plotted in red. The dashed vertical line represents the roll of the G6-G7 base-pair step from the HMGB1a-CP-DNA crystal structure. The frequency distribution histograms were calculated from the structures obtained at every picosecond over the final 45 ns of each equilibrated MD simulation, resulting in a total of 45 000 structures each for CP- and OX-DNA in the TGGA and AGGC sequence contexts. The distribution is plotted against the number of structures in the trajectory.

Similar articles

Cited by

References

    1. Chaney SG, Campbell SL, Bassett E, Wu Y. Recognition and processing of cisplatin- and oxaliplatin-DNA adducts. Crit. Rev. Oncol. Hematol. 2005;53:L3–L11. - PubMed
    1. Jamieson ER, Lippard SJ. Structure, recognition, and processing of cisplatin-DNA adducts. Chem. Rev. 1999;99:2467–2498. - PubMed
    1. Page JD, Husain I, Sancar A, Chaney SG. Effect of the diaminocyclohexane carrier ligand on platinum adduct formation, repair, and lethality. Biochemistry. 1990;29:1016–1024. - PubMed
    1. Jennerwein MM, Eastman A, Khokhar AR. Characterization of adducts produced in DNA by isomeric 1,2-diaminocyclohexaneplatinum(II) complexes. Chem. Biol. Interact. 1989;70:39–49. - PubMed
    1. Woynarowski JM, Chapman WG, Napier C, Herzig MCS, Juniewicz P. Sequence- and region-specificity of oxaliplatin adducts in naked and cellular DNA. Mol. Pharmacol. 1998;54:770–777. - PubMed

Publication types