. 2009 Apr 15;587(Pt 8):1843-56.
doi: 10.1113/jphysiol.2008.166397. Epub 2009 Mar 2.

Muscular and pulmonary O2 uptake kinetics during moderate- and high-intensity sub-maximal knee-extensor exercise in humans

Affiliations

Muscular and pulmonary O2 uptake kinetics during moderate- and high-intensity sub-maximal knee-extensor exercise in humans

P Krustrup et al. J Physiol. .

Abstract

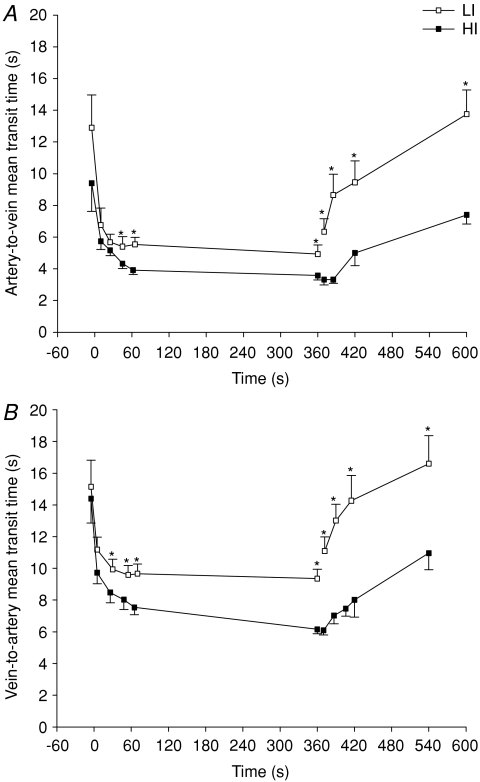
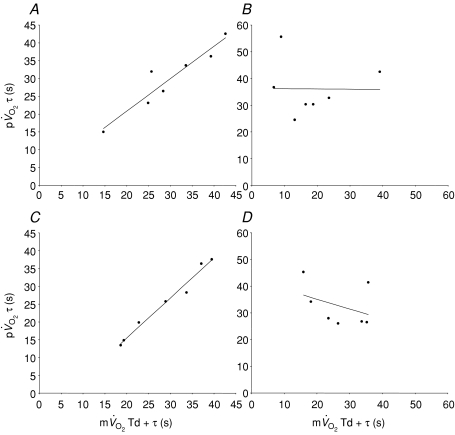
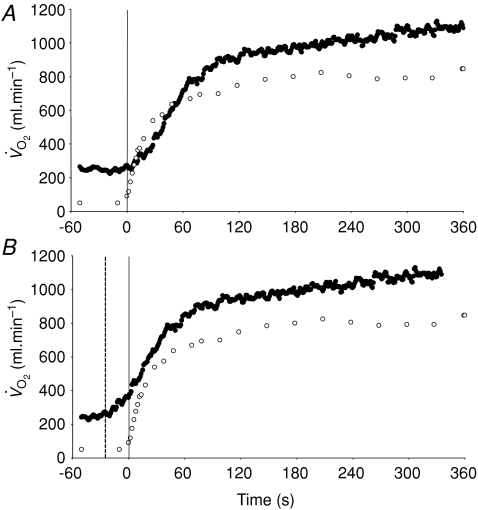
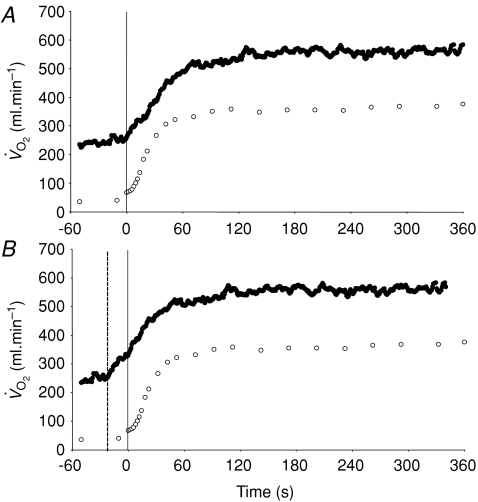
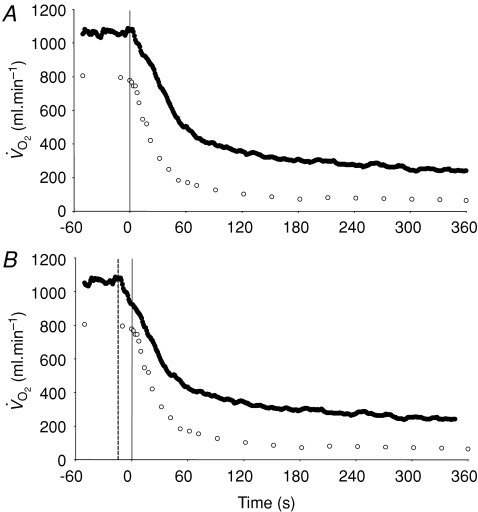
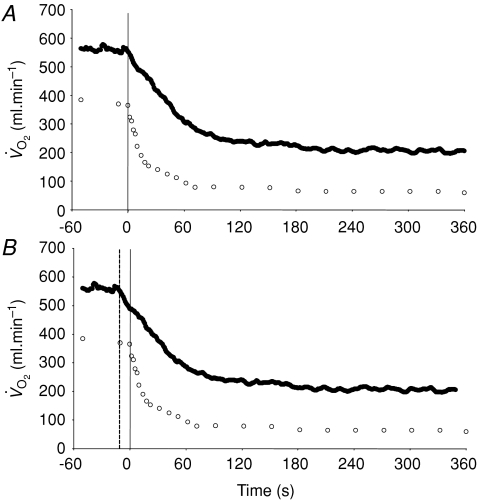
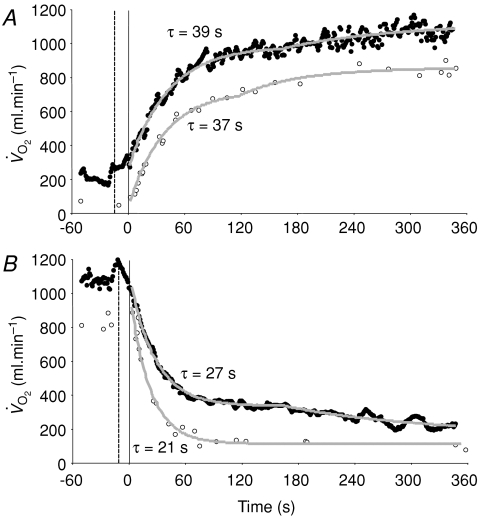
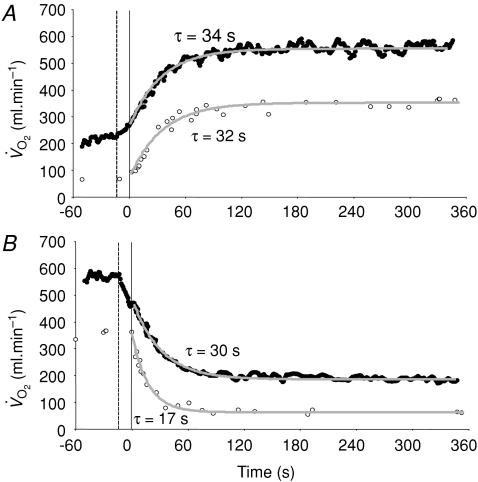
The purpose of this investigation was to determine the contribution of muscle O(2) consumption (mVO2) to pulmonary O(2) uptake (pVO2) during both low-intensity (LI) and high-intensity (HI) knee-extension exercise, and during subsequent recovery, in humans. Seven healthy male subjects (age 20-25 years) completed a series of LI and HI square-wave exercise tests in which mVO2 (direct Fick technique) and pVO2 (indirect calorimetry) were measured simultaneously. The mean blood transit time from the muscle capillaries to the lung (MTTc-l) was also estimated (based on measured blood transit times from femoral artery to vein and vein to artery). The kinetics of mVO2 and pVO2 were modelled using non-linear regression. The time constant (tau) describing the phase II pVO2 kinetics following the onset of exercise was not significantly different from the mean response time (initial time delay + tau) for mVO2 kinetics for LI (30 +/- 3 vs 30 +/- 3 s) but was slightly higher (P < 0.05) for HI (32 +/- 3 vs 29 +/- 4 s); the responses were closely correlated (r = 0.95 and r = 0.95; P < 0.01) for both intensities. In recovery, agreement between the responses was more limited both for LI (36 +/- 4 vs 18 +/- 4 s, P < 0.05; r = -0.01) and HI (33 +/- 3 vs 27 +/- 3 s, P > 0.05; r = -0.40). MTTc-l was approximately 17 s just before exercise and decreased to 12 and 10 s after 5 s of exercise for LI and HI, respectively. These data indicate that the phase II pVO2 kinetics reflect mVO2 kinetics during exercise but not during recovery where caution in data interpretation is advised. Increased mVO2 probably makes a small contribution to during the first 15-20 s of exercise.


Figures

Figure 1
Figure 1. Schematic representation of the experimental protocol
The subjects performed four 6 min moderate-intensity knee-extensor exercise bouts (EX1–4) interspersed with 30 min rest periods, followed by four 6 min high-intensity knee-extensor exercise bouts (EX5–8) interspersed with 45 min rest periods. During EX1–2 and EX5–6, femoral arterial blood samples (BSa) and venous blood samples (BSv) were collected and thigh blood flow was measured. During EX3 and EX7, the vein-to-artery transit time (TTv-a) was determined and venous blood samples were collected. During EX4 and EX8, the artery-to-vein transit time (TTa-v) was determined.
Figure 2
Figure 2. Mean artery-to-vein (A) and vein-to-artery (B) transit times during 6 min of low-intensity and high-intensity sub-maximal knee-extensor exercise followed by a 6 min recovery period
Values are mean ±s.e.m. *LI significantly different from HI.
Figure 5
Figure 5. Pearson product moment correlation coefficients between the time constant for the phase II3 of pulmonary oxygen uptake and the mean response time for the fundamental increase in muscle oxygen uptake for low-intensity exercise (A; r= 0.95) and recovery (B; r=−0.01) and high-intensity exercise (C; r= 0.95) and recovery (D; r=−0.40)
Note the close agreement for the on-transient and the poor agreement for the off-transient.
Figure 4
Figure 4. Group mean muscle oxygen uptake (○) and pulmonary oxygen uptake (•) across the transition to 6 min of high-intensity exercise
The continuous vertical line represents the onset of exercise. A illustrates the ‘raw’ data whereas in B the pulmonary data have been ‘time-aligned’ to the muscle data by moving the data back by a time equal to the time delay preceding the phase II increase in pulmonary oxygen uptake (dashed vertical line).
Figure 3
Figure 3. Group mean muscle oxygen uptake (○) and pulmonary oxygen uptake (•) across the transition to 6 min of low-intensity exercise The continuous vertical line represents the onset of exercise
A illustrates the ‘raw’ data whereas in B the pulmonary data have been ‘time-aligned’ to the muscle data by moving the data back by a time equal to the time delay preceding the phase II increase in pulmonary oxygen uptake (dashed vertical line).
Figure 7
Figure 7. Group mean muscle oxygen uptake (○) and pulmonary oxygen uptake (•) in the recovery from high-intensity exercise
The continuous vertical line represents the end of exercise. A illustrates the ‘raw’ data whereas in B the pulmonary data have been ‘time-aligned’ to the muscle data by moving the data back by a time equal to the time delay preceding the phase II decrease in pulmonary oxygen uptake (dashed vertical line).
Figure 6
Figure 6. Group mean muscle oxygen uptake (○) and pulmonary oxygen uptake (•) in the recovery from low-intensity exercise
The continuous vertical line represents the end of exercise. A illustrates the ‘raw’ data whereas in B the pulmonary data have been ‘time-aligned’ to the muscle data by moving the data back by a time equal to the time delay preceding the phase II decrease in pulmonary oxygen uptake (dashed vertical line).
Figure 9
Figure 9. Muscle (○) and pulmonary (•) oxygen uptake responses to HI exercise (A) and subsequent recovery (B), with corresponding model fits and time constant values shown
The pulmonary data have been ‘time-aligned’ to the muscle data by moving the data back by a time equal to the time delay preceding the phase II decrease in pulmonary oxygen uptake (dashed vertical line).
Figure 8
Figure 8. Muscle (○) and pulmonary (•) oxygen uptake responses to LI exercise (A) and subsequent recovery (B), with corresponding model fits and time constant values shown
The pulmonary data have been ‘time-aligned’ to the muscle data by moving the data back by a time equal to the time delay preceding the phase II decrease in pulmonary oxygen uptake (dashed vertical line).

References

    1. Aaron EA, Johnson BD, Seow CK, Dempsey JA. Oxygen cost of exercise hyperpnea: measurement. J Appl Physiol. 1992;72:1810–1817. - PubMed
    1. Andersen P, Adams RP, Sjøgaard G, Thorboe A, Saltin B. Dynamic knee extension as a model for the study of an isolated exercising muscle in man. J Appl Physiol. 1985;59:1647–1653. - PubMed
    1. Andersen P, Saltin B. Maximal perfusion of skeletal muscle in man. J Physiol. 1985;366:233–249. - PMC - PubMed
    1. Bangsbo J, Gollnick PD, Graham TE, Juel C, Kiens B, Mizuno M, Saltin B. Anaerobic energy production and O2 deficit-debt relationship during exhaustive exercise in humans. J Physiol. 1990;422:539–559. - PMC - PubMed
    1. Bangsbo J, Krustrup P, González-Alonso J, Boushel R, Saltin B. Muscle oxygen uptake kinetics at onset of intense dynamic exercise. Am J Physiol Regul Integr Comp Physiol. 2000;279:R899–R906. - PubMed

Publication types